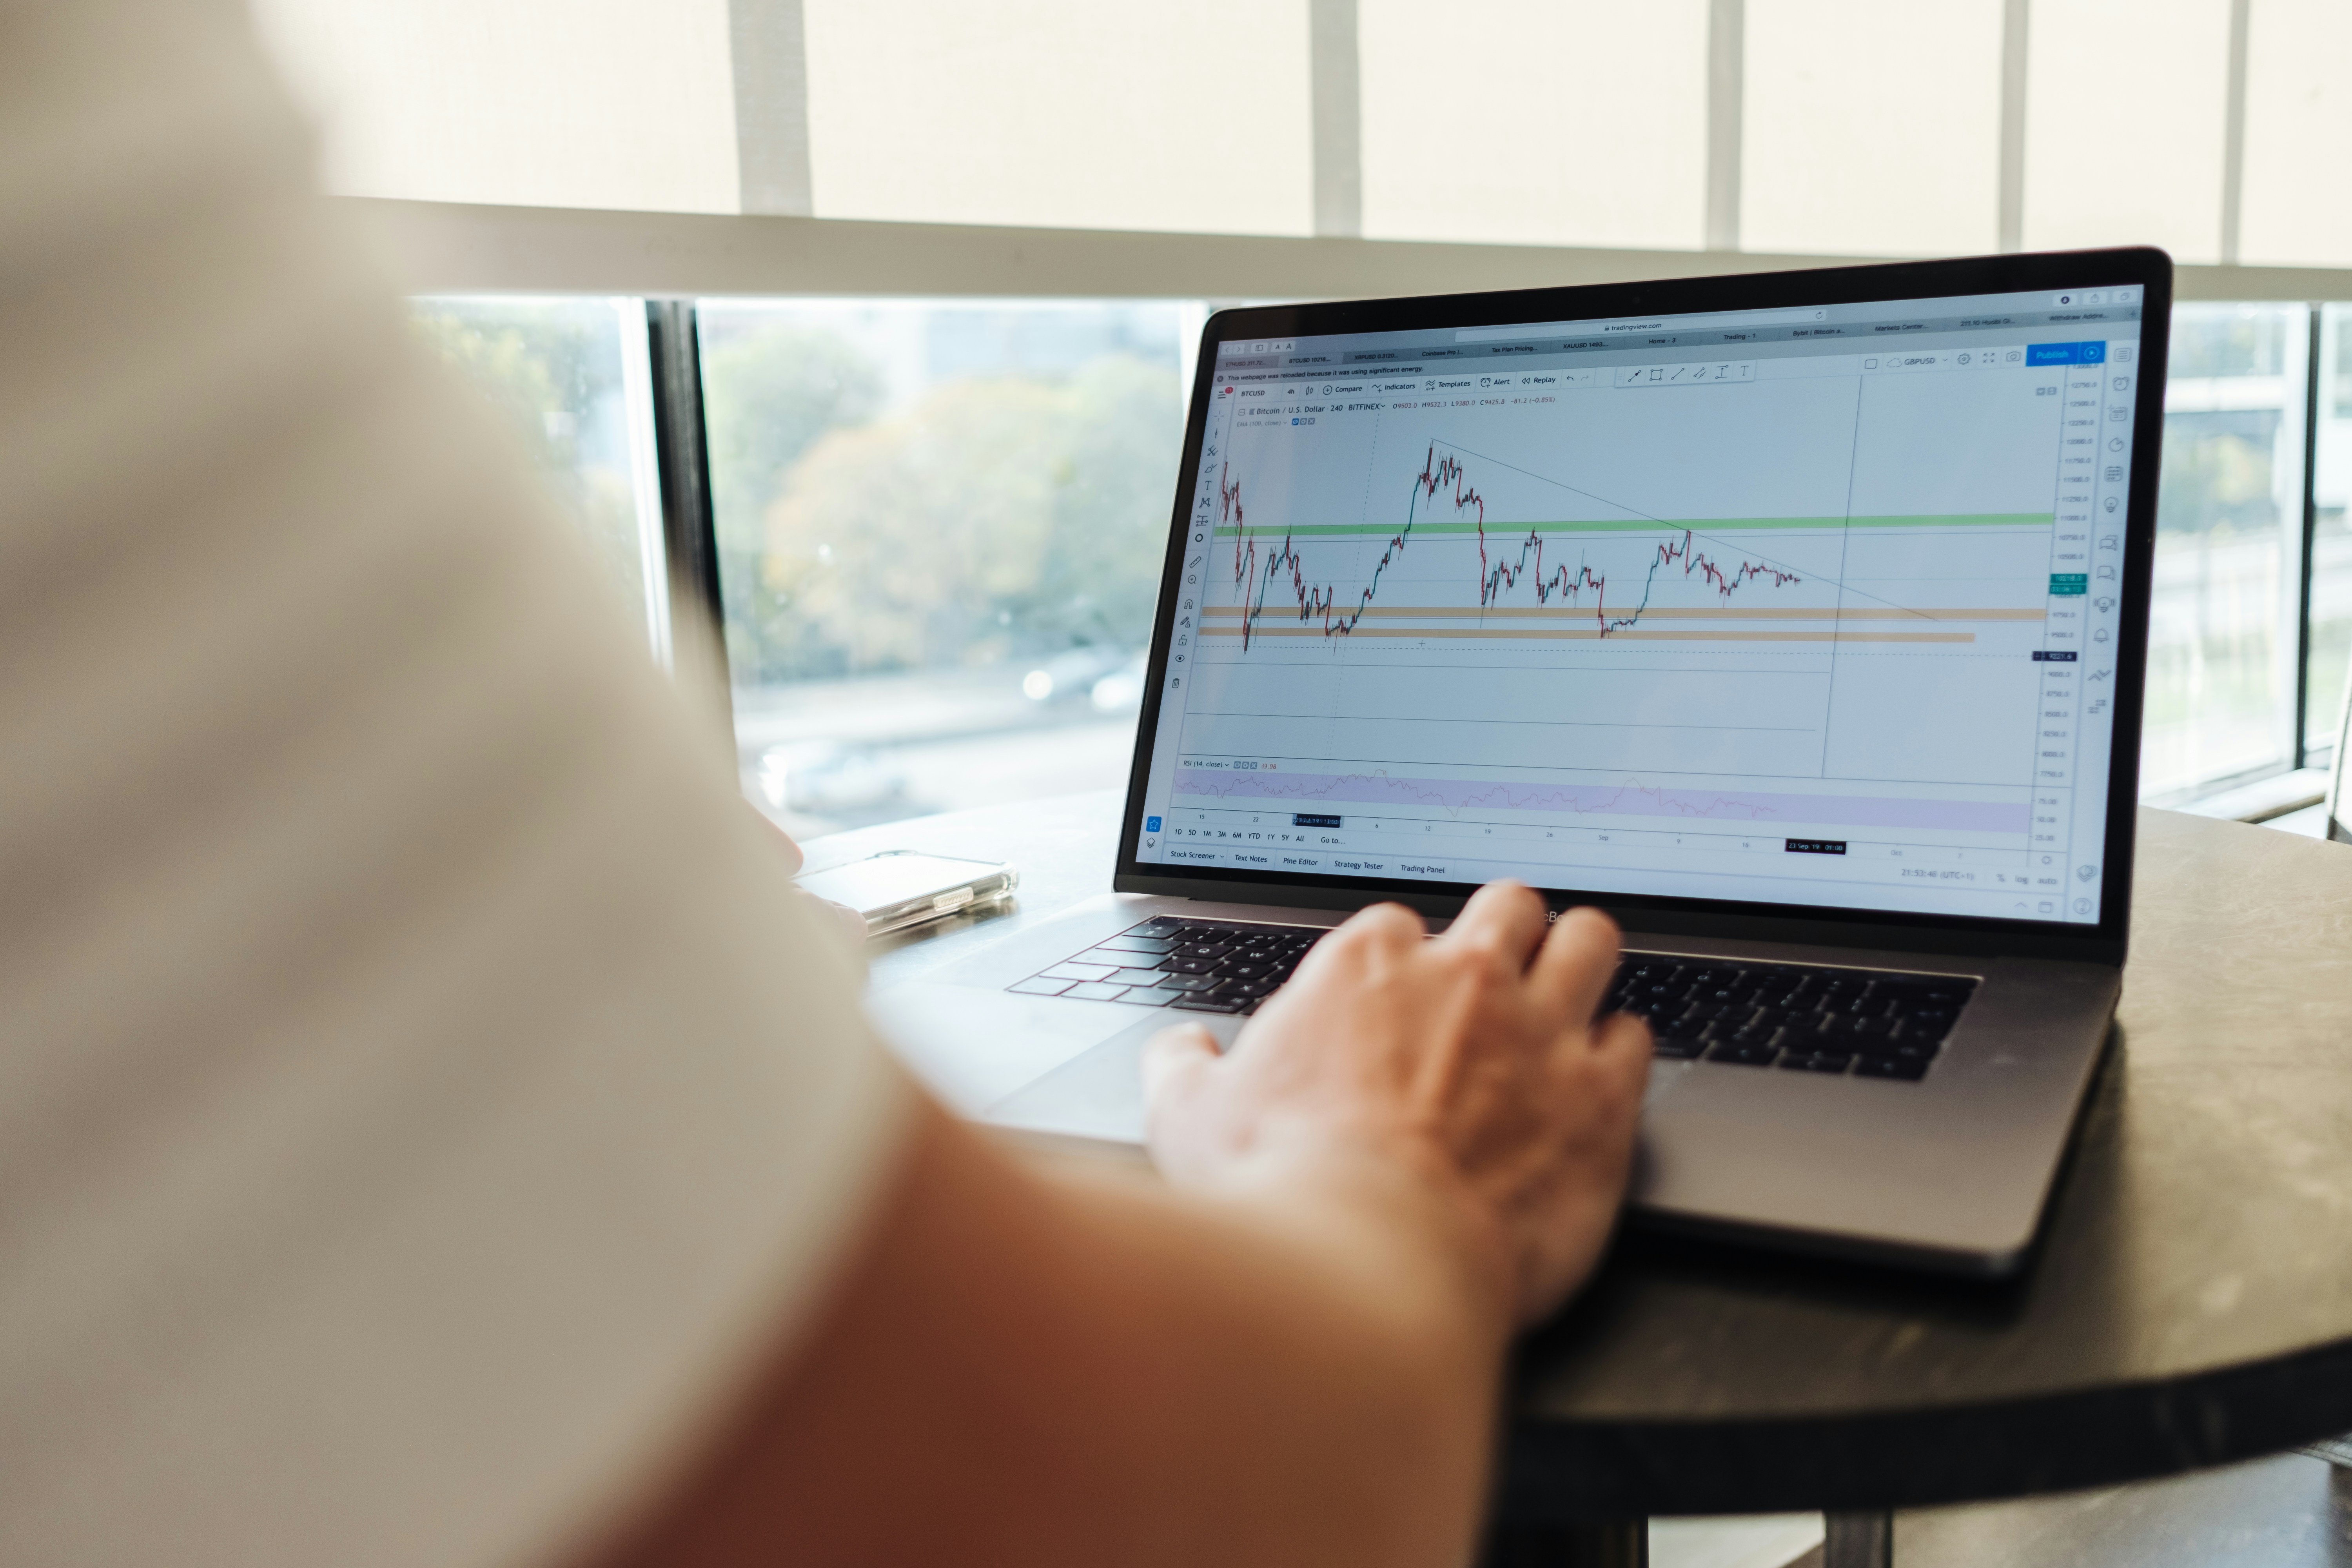
What are channels and how to put them on a chart? In technical analysis, this concept helps traders understand how price moves between two clear trend lines. Instead of looking at random candles, traders use these lines to see structure, direction, and possible trading zones.
A price channel usually appears when the market respects an upper line and a lower line. The upper line often works as resistance, while the lower line often works as support. As a result, traders can study where price may react, continue, or break out.
To draw it properly, start by finding a clear trend. Then connect at least two major highs or two major lows. After that, place a parallel line on the opposite side of the price movement. This creates a visual path that helps you read the market more clearly.
For more learning, you can also explore our technical analysis basics or read an external guide from Investopedia.

A rising structure forms when price keeps creating higher highs and higher lows. This movement shows that buyers are still active and that the market has an upward direction.
Traders usually watch the lower line carefully because it may act as a possible buying area. However, they should not enter a trade only because price touches the line. Instead, they should wait for confirmation, such as a strong candle reaction, volume support, or another technical signal.
This type of structure can help traders follow the trend with more confidence. Still, risk management remains important because any pattern can fail when market conditions change.

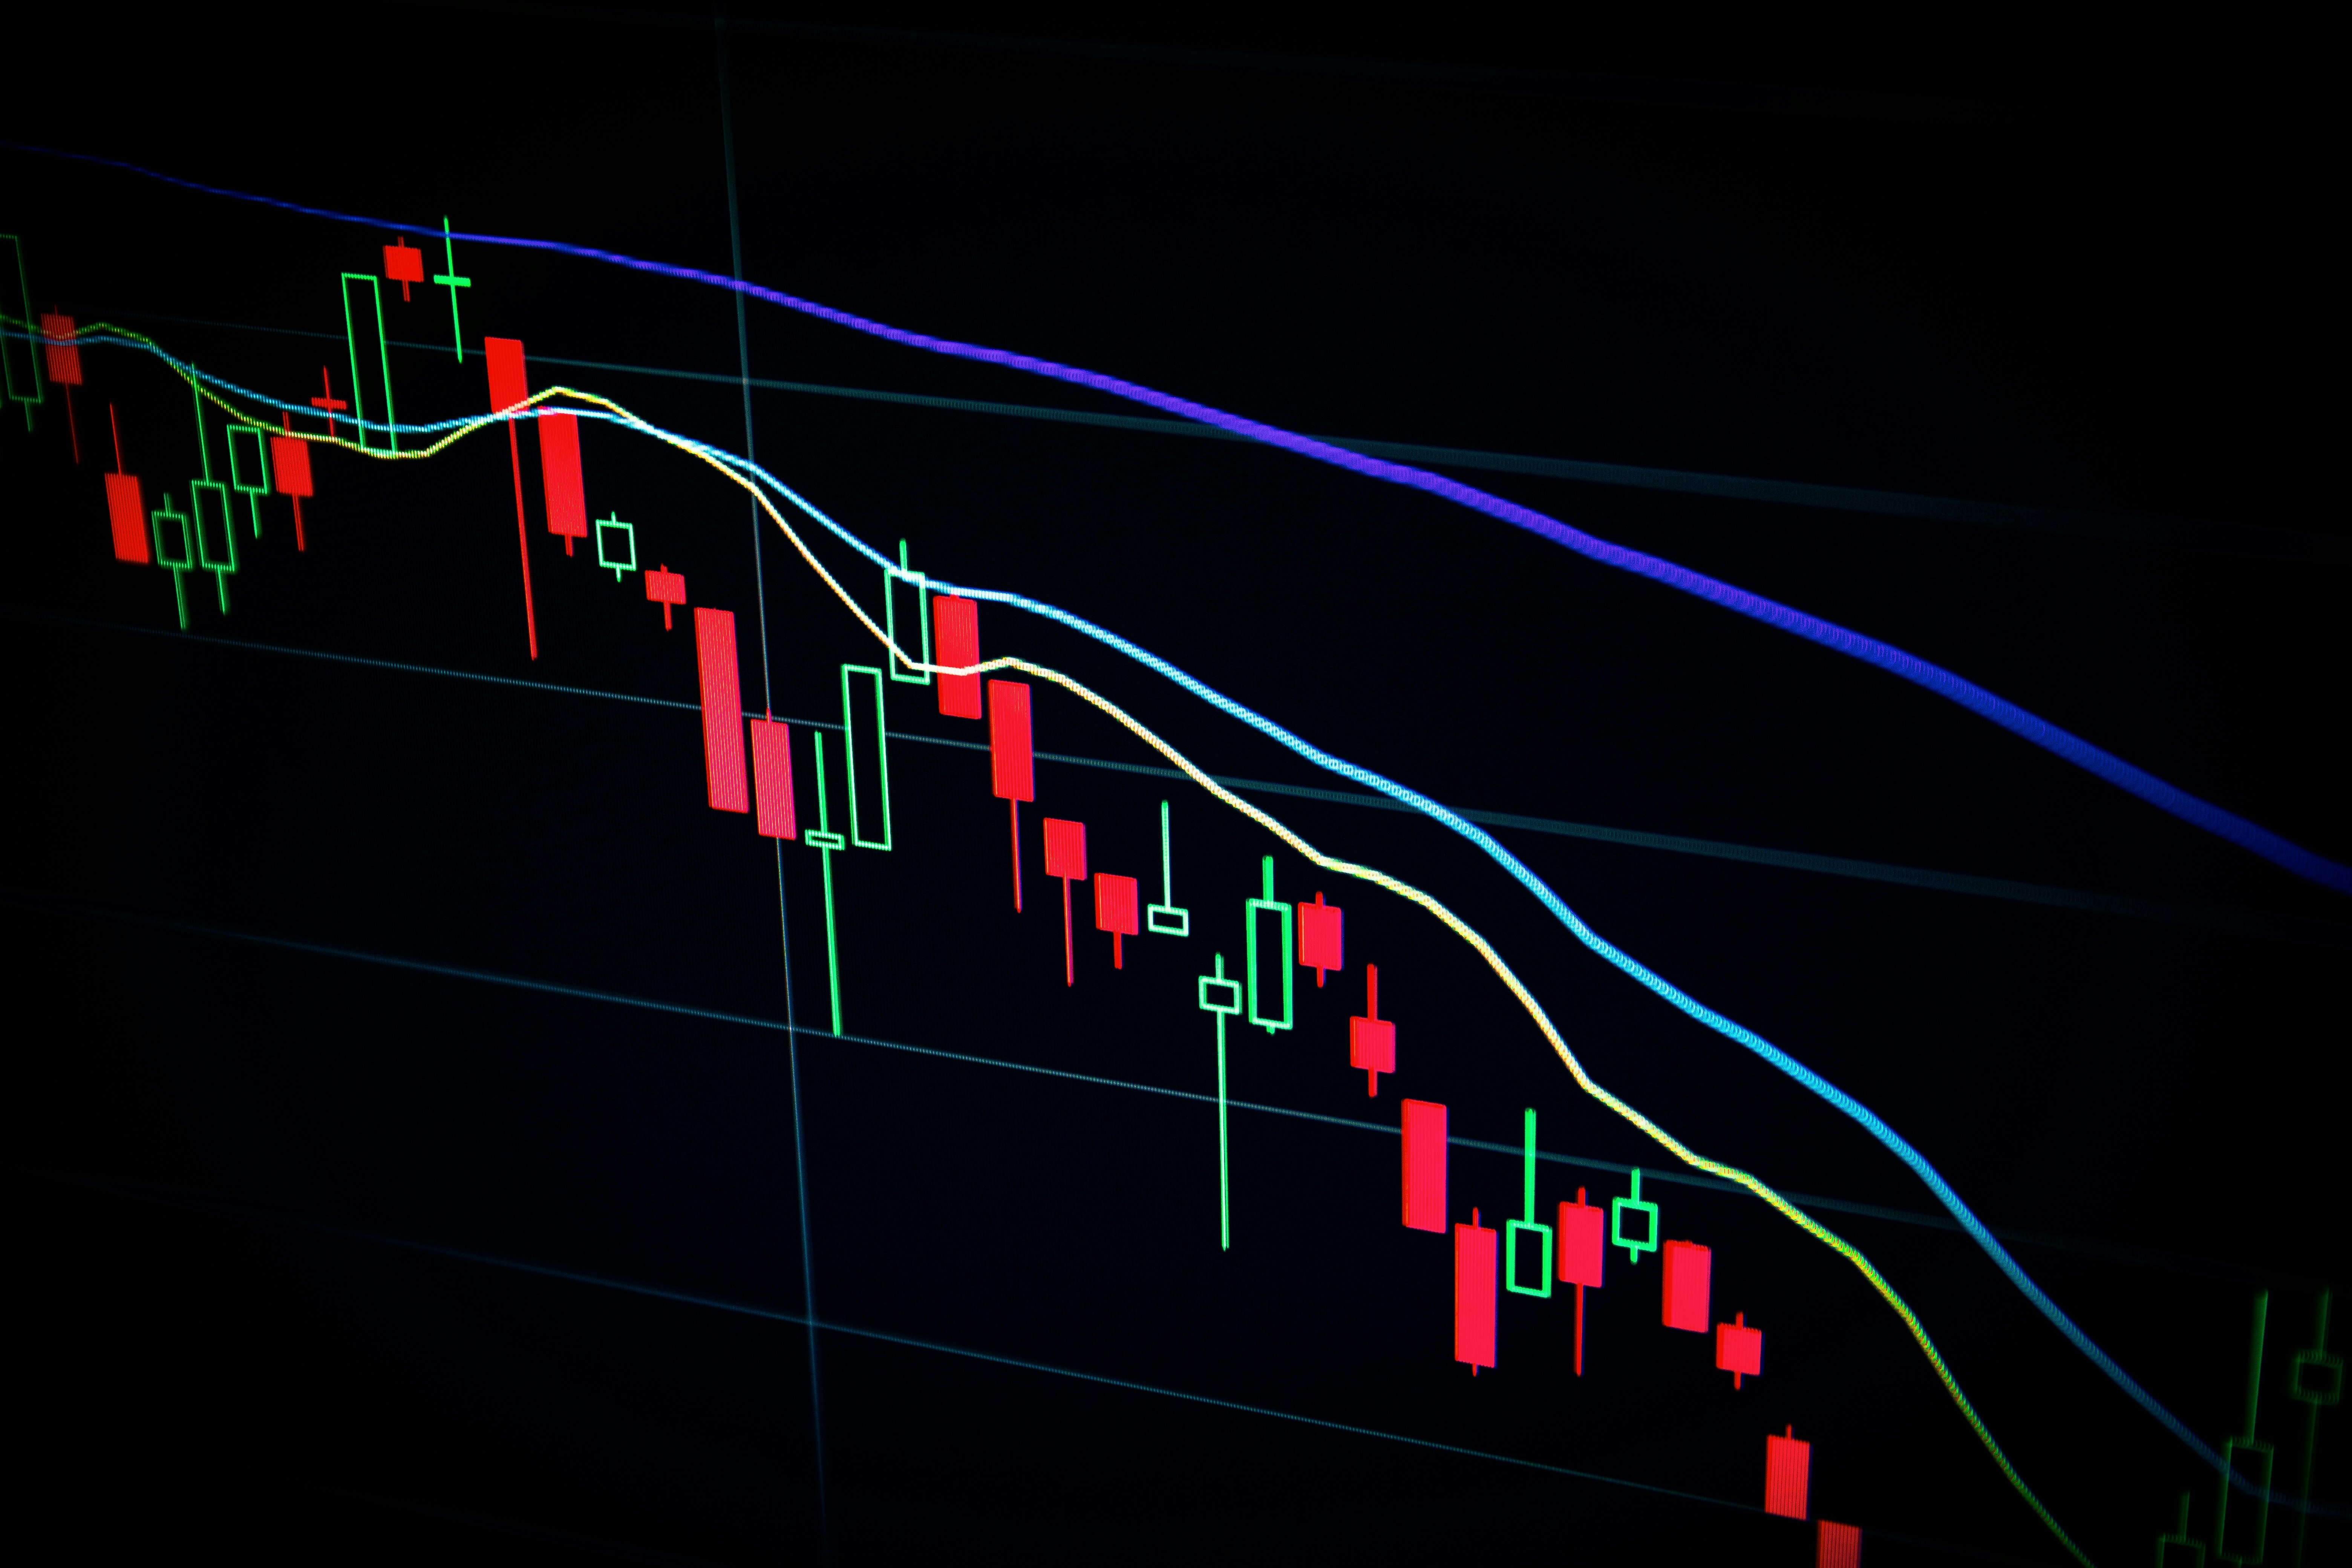
A falling structure appears when price forms lower highs and lower lows. This usually shows that sellers control the market and that the general direction is bearish.
In this situation, traders often focus on the upper line. If price reaches that area and fails to break above it, the market may continue lower. Therefore, many traders use this zone to plan possible sell setups.
Even so, a breakout above the upper line can change the picture. For that reason, traders should always combine the pattern with confirmation and a clear exit plan.
A sideways range forms when price moves between almost equal highs and lows. In this case, the market does not show a strong upward or downward trend.
Traders often use the lower area as possible support and the upper area as possible resistance. However, sideways movement can become risky when price breaks out suddenly. Because of that, traders should watch volume, candle strength, and market news before making decisions.
In short, this tool helps traders organize price action, reduce confusion, and build better trading plans. It does not guarantee results, but it can make chart reading easier when used with discipline.