
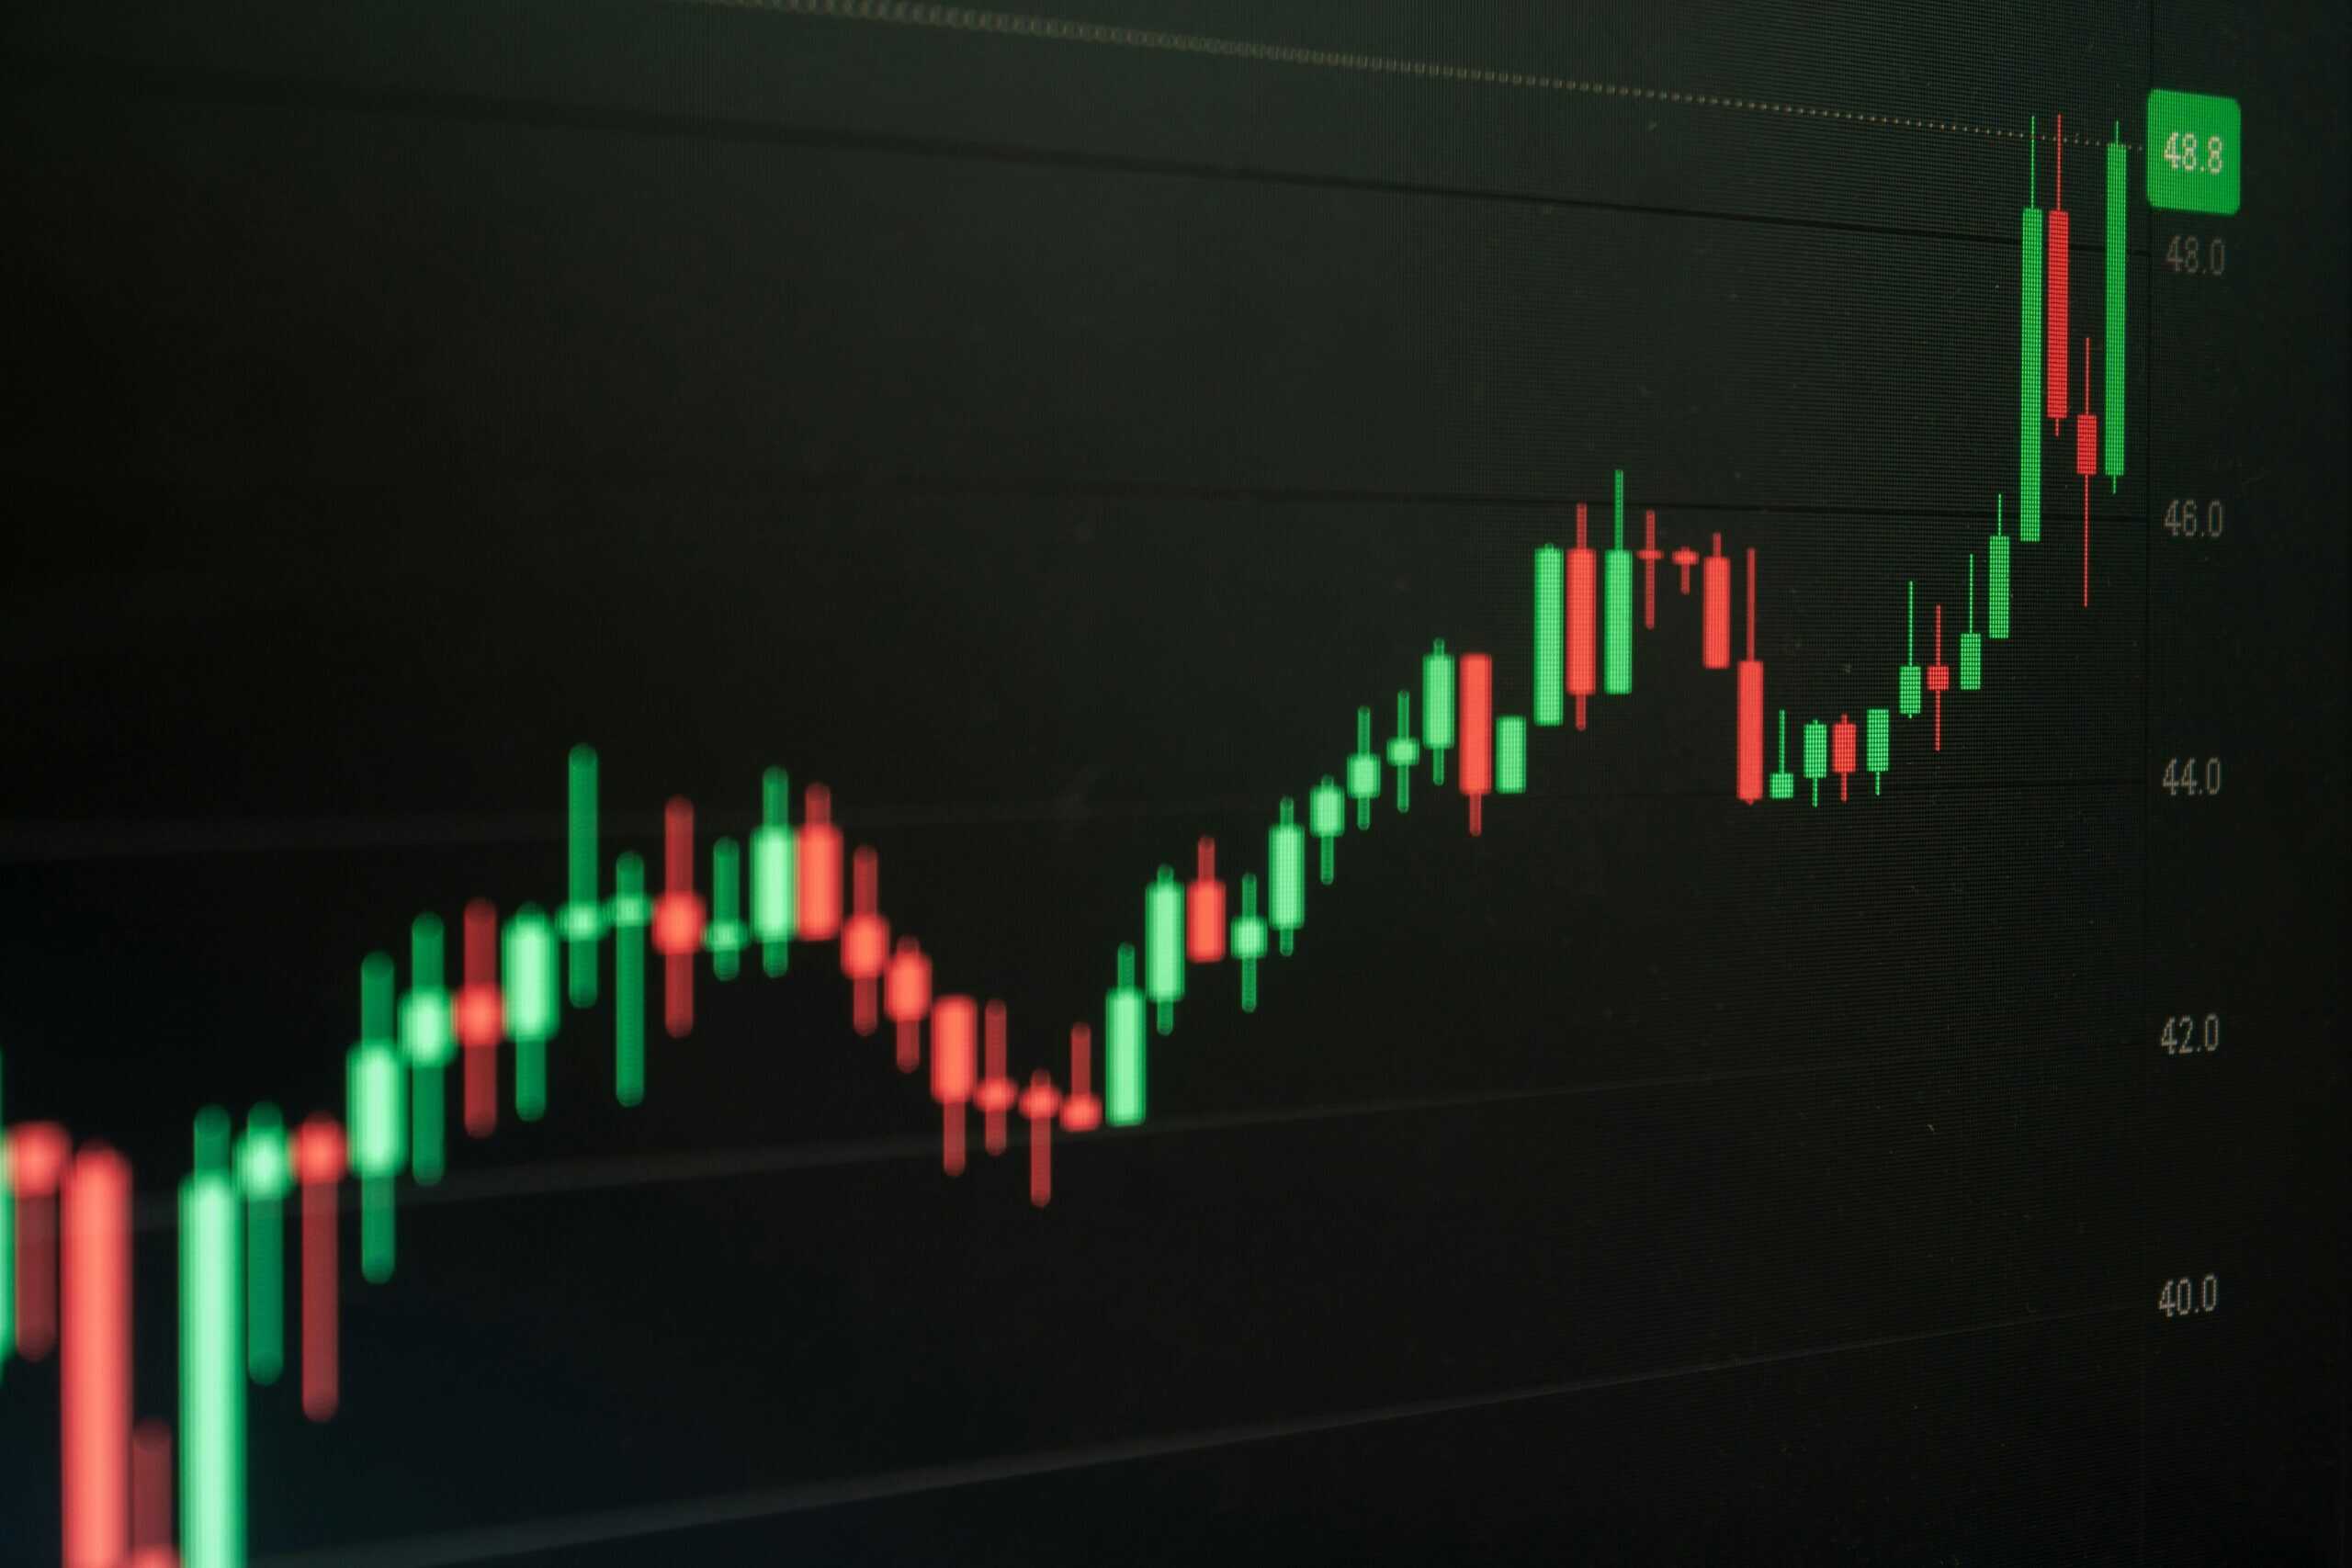
Chart types help traders display price movement in different visual formats. The most common types are line charts, bar charts, and Japanese candlestick charts.
First, traders use charts to understand how the price changes over time. Then, they compare different formats to choose the one that gives the clearest view of the market.
On CG Invest trading platforms, charts use bid prices. However, traders can still view the ask price as a separate horizontal line beside the price action.
For deeper learning, review our technical analysis guide or read more from Investopedia.

A line chart is the simplest format. It shows only the closing price for each selected time period, such as one minute, one hour, or one day.
Because it connects closing prices with a continuous line, it gives traders a clean view of the general price direction.
However, this format does not show the open, high, and low prices. Therefore, traders usually use it for a quick overview rather than detailed analysis.

A bar chart gives traders more detail than a line chart. It shows the opening price, closing price, highest price, and lowest price for each period.
Traders often call this information O-H-L-C, which means Open, High, Low, and Close. As a result, they can understand both direction and price range.
This chart format works well for traders who want more information without using candlesticks.
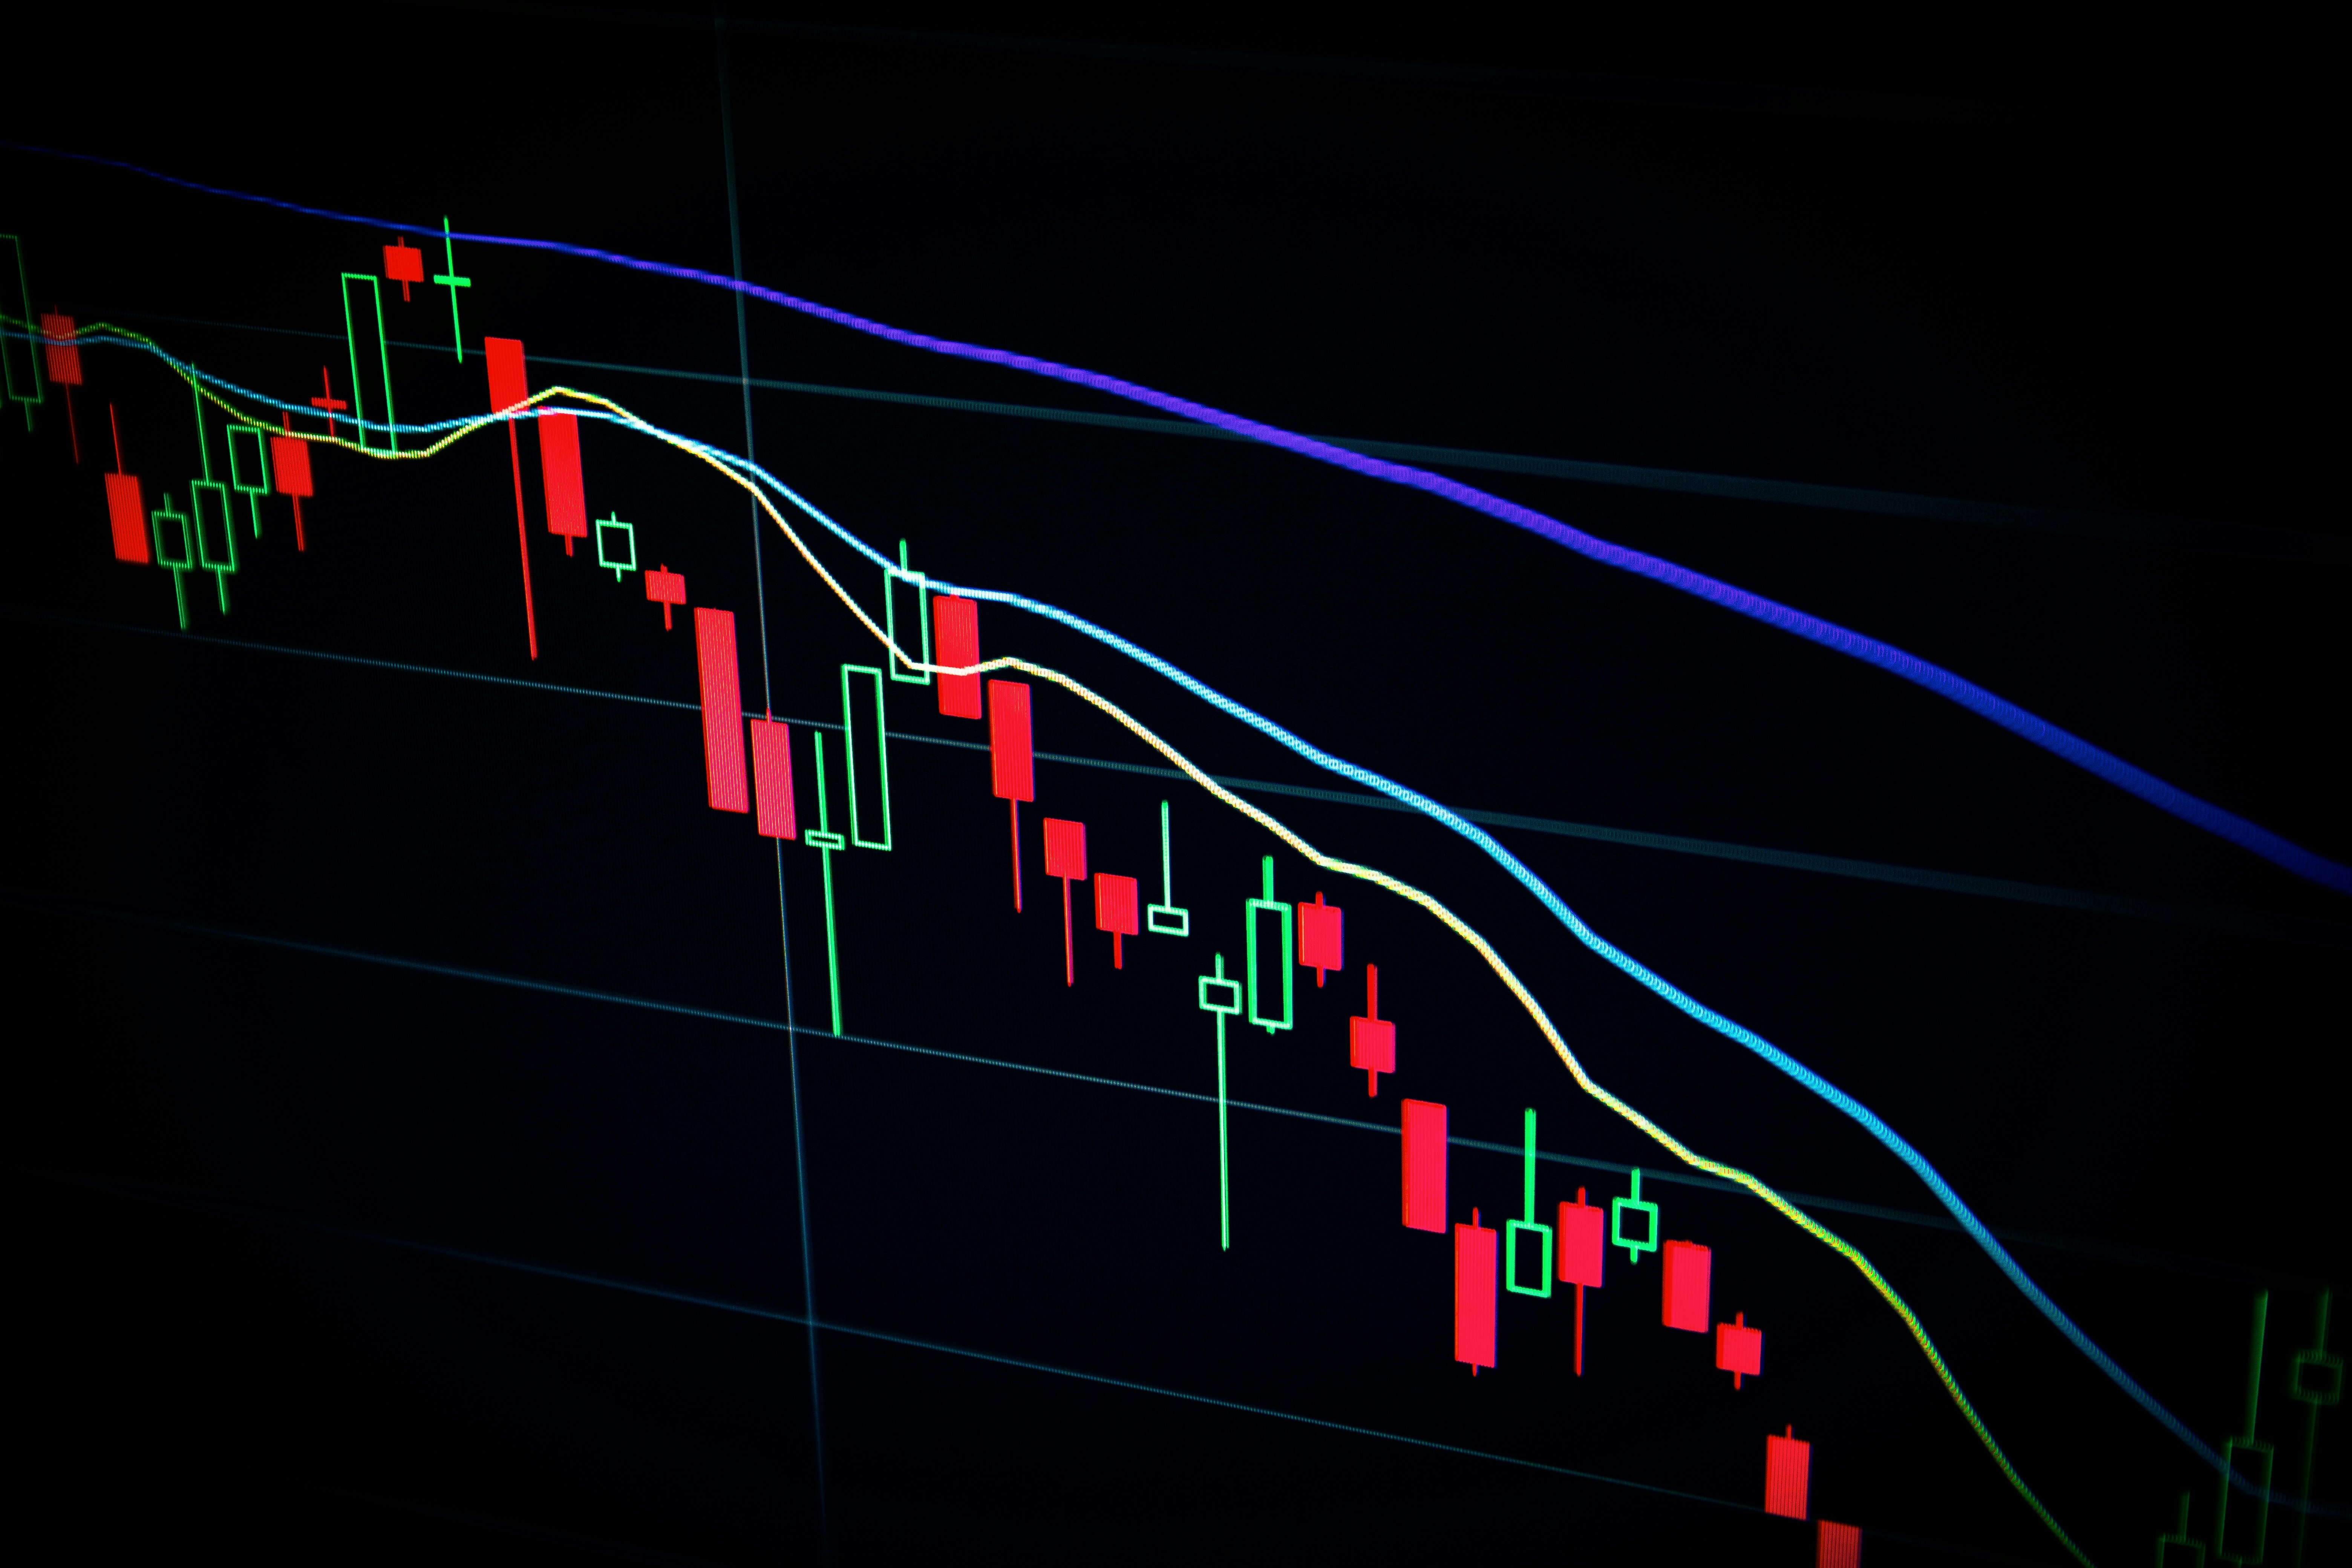
A bar contains one vertical line and two small horizontal markers. The left marker shows the opening price, while the right marker shows the closing price.
The top of the vertical line shows the highest price during the period. Meanwhile, the bottom shows the lowest price.
Although bar charts provide useful information, many beginners find them harder to read than candlestick charts.
Japanese candlestick charts are among the most popular formats in trading. They show the same O-H-L-C data, but they present it in a clearer visual style.
Each candle helps traders understand whether buyers or sellers controlled the selected period. Therefore, candlesticks make price action easier to read.
Today, many traders prefer candlesticks because they combine detail, clarity, and visual speed.

Each candlestick has a body and wicks. The body shows the distance between the opening price and the closing price.
The upper wick shows the highest price reached during the period. In contrast, the lower wick shows the lowest price reached.
Because of this structure, traders can quickly understand strength, weakness, and possible market reaction.

In summary, line charts show closing prices only, bar charts show full O-H-L-C data, and candlestick charts present the same information in a visual way.
Therefore, each format has a different purpose. Beginners may start with line charts, while active traders often prefer candlesticks.
Overall, understanding chart types helps traders read market movement more clearly and choose the right format for their analysis.