Technical analysis is a fundamental component of financial markets.
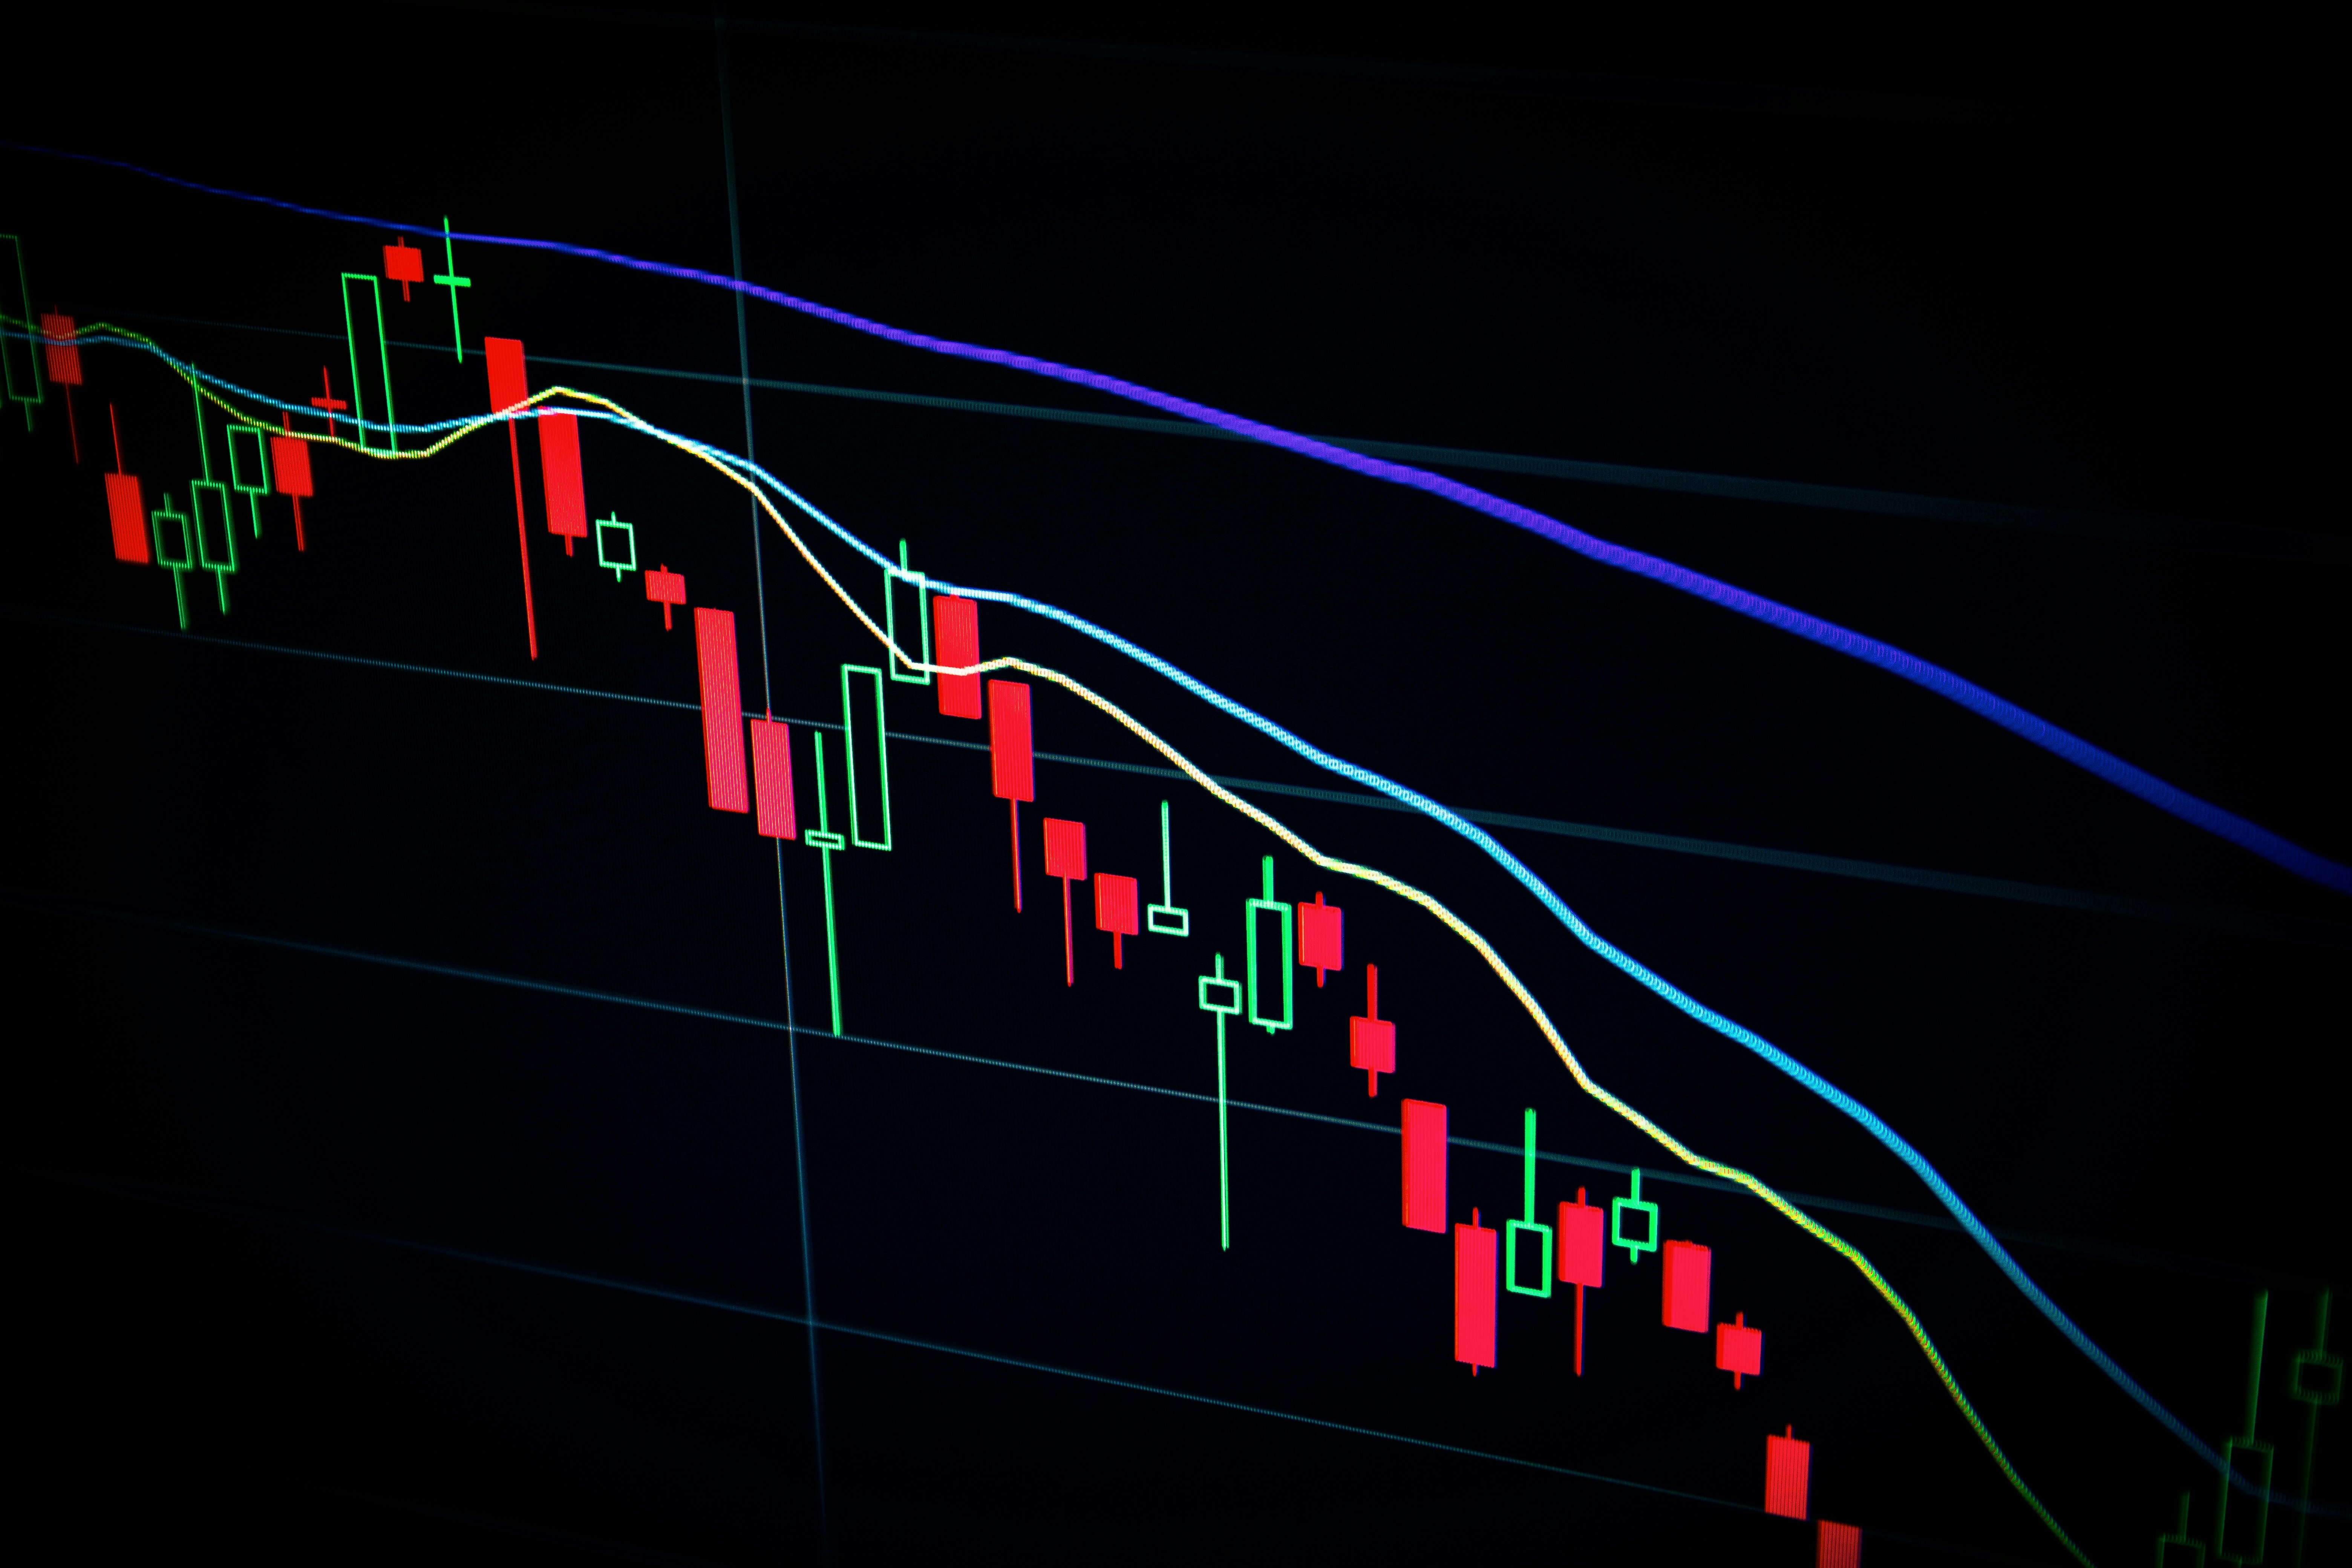
Every trader wants to understand where an asset’s price is heading, and the first place to look for answers is the live price chart. By observing price behaviour, traders can begin to form expectations about future movements.
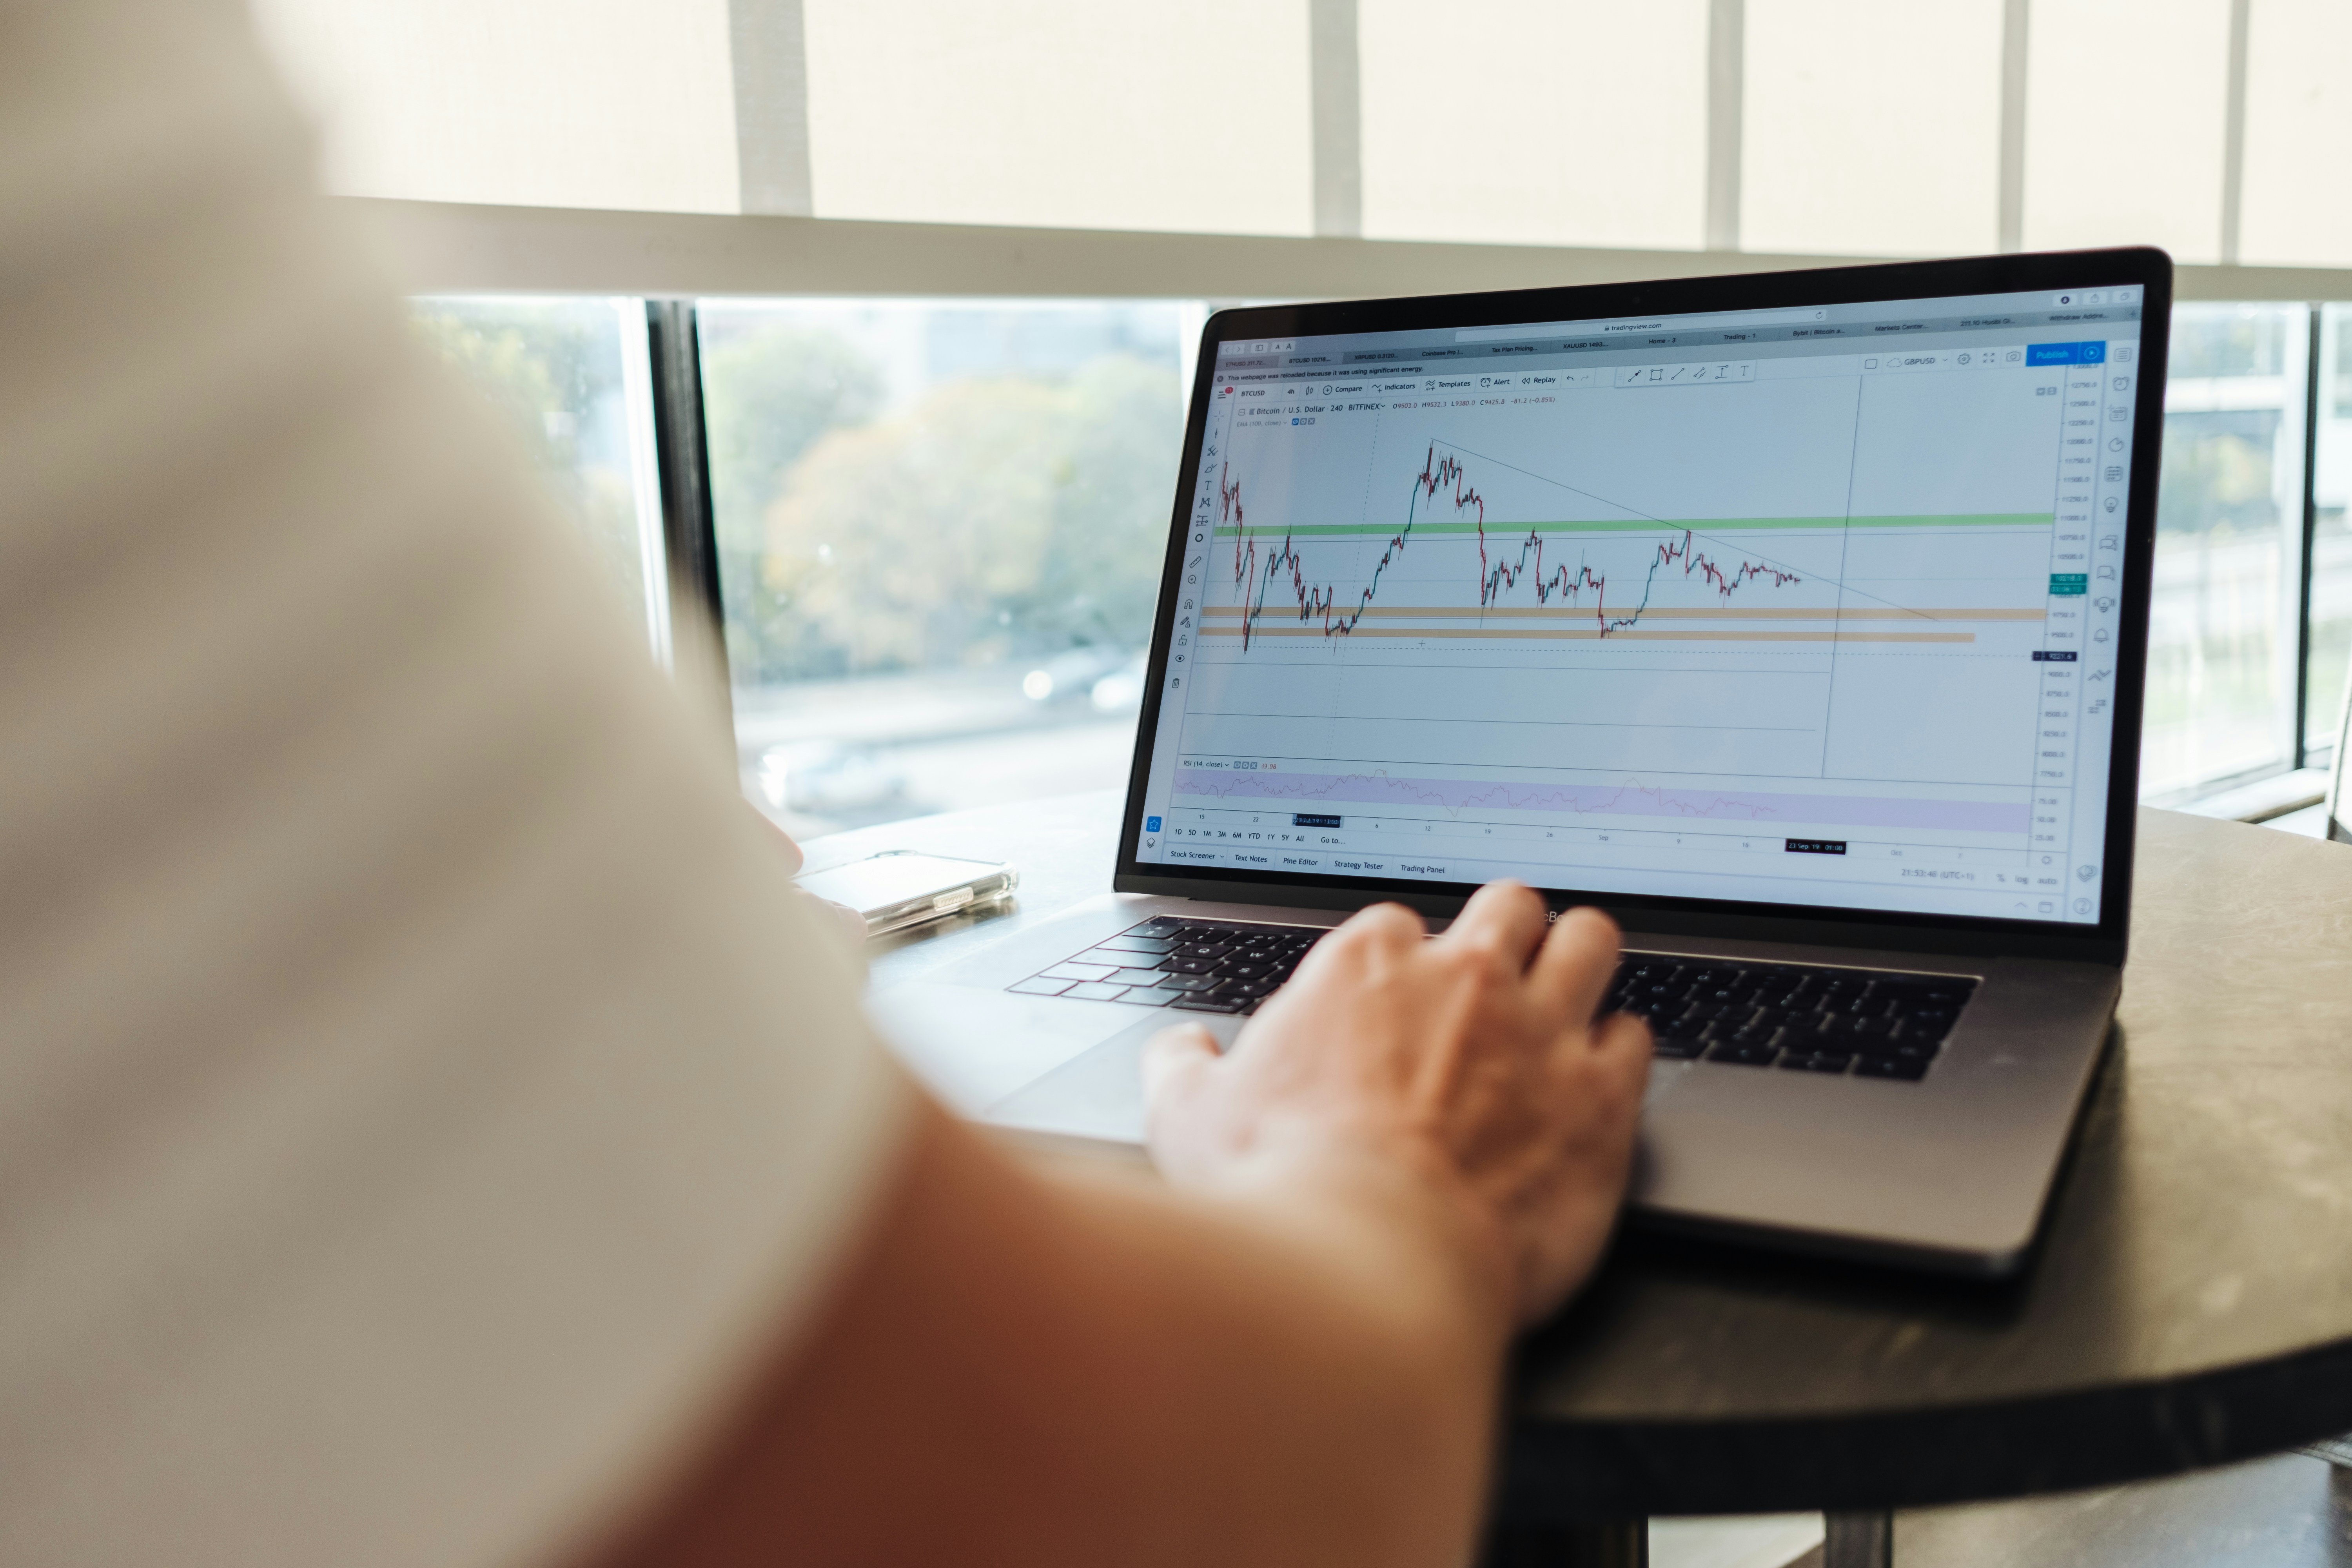
Even beginners can explore trading platforms and start identifying recurring patterns. Surprisingly, these patterns do exist. Price charts function like a universal language, much like mathematics. Just as formulas and graphs can be understood by mathematicians anywhere in the world, chart patterns can be recognised and interpreted by traders regardless of location.

The same principle applies to traders and analysts across the globe. Over time, they have developed a shared way of interpreting price charts, allowing them to identify trading signals and make decisions based on different strategies.
Their primary tools are known as technical indicators. These are typically displayed as lines or visual elements that are overlaid on the price chart or shown in a separate window below it, helping traders analyse market behaviour and potential price movements.
Indicators are used to highlight the direction of the prevailing trend, while oscillators help identify potential turning points in price movement. They are built on specific mathematical formulas that are calculated automatically and presented visually on the trading platform.
It is generally believed that combining signals from multiple indicators can provide a more comprehensive view of market conditions and improve the ability to anticipate future price movements.

Once again, technical indicators are generally divided into two main categories: trend indicators and oscillators.
Trend indicators are typically lagging in nature. They are used to confirm that a price trend already exists and usually generate signals after a reversal or change in direction has taken place, rather than predicting it in advance.

Oscillators are designed to provide early signals of potential trend changes. They evaluate the strength of current price movement and help determine whether momentum in a rising or falling market is still strong, or whether a correction is likely to occur, meaning a temporary move in the opposite direction.