A trend line is one of the most fundamental tools in technical analysis, used to identify and highlight the current direction of price movement.
To draw a trend line on the chart, you need to identify at least two significant highs or two significant lows and then connect them using the trend line tool available on the trading platform. This helps visualise whether the market is moving upward, downward, or sideways.

An upward trend is identified when both the highs and the lows on the price chart continue to move higher over time.
If the price falls below the previous low, this is often seen as a signal that the existing trend may be coming to an end and a reversal could be forming.

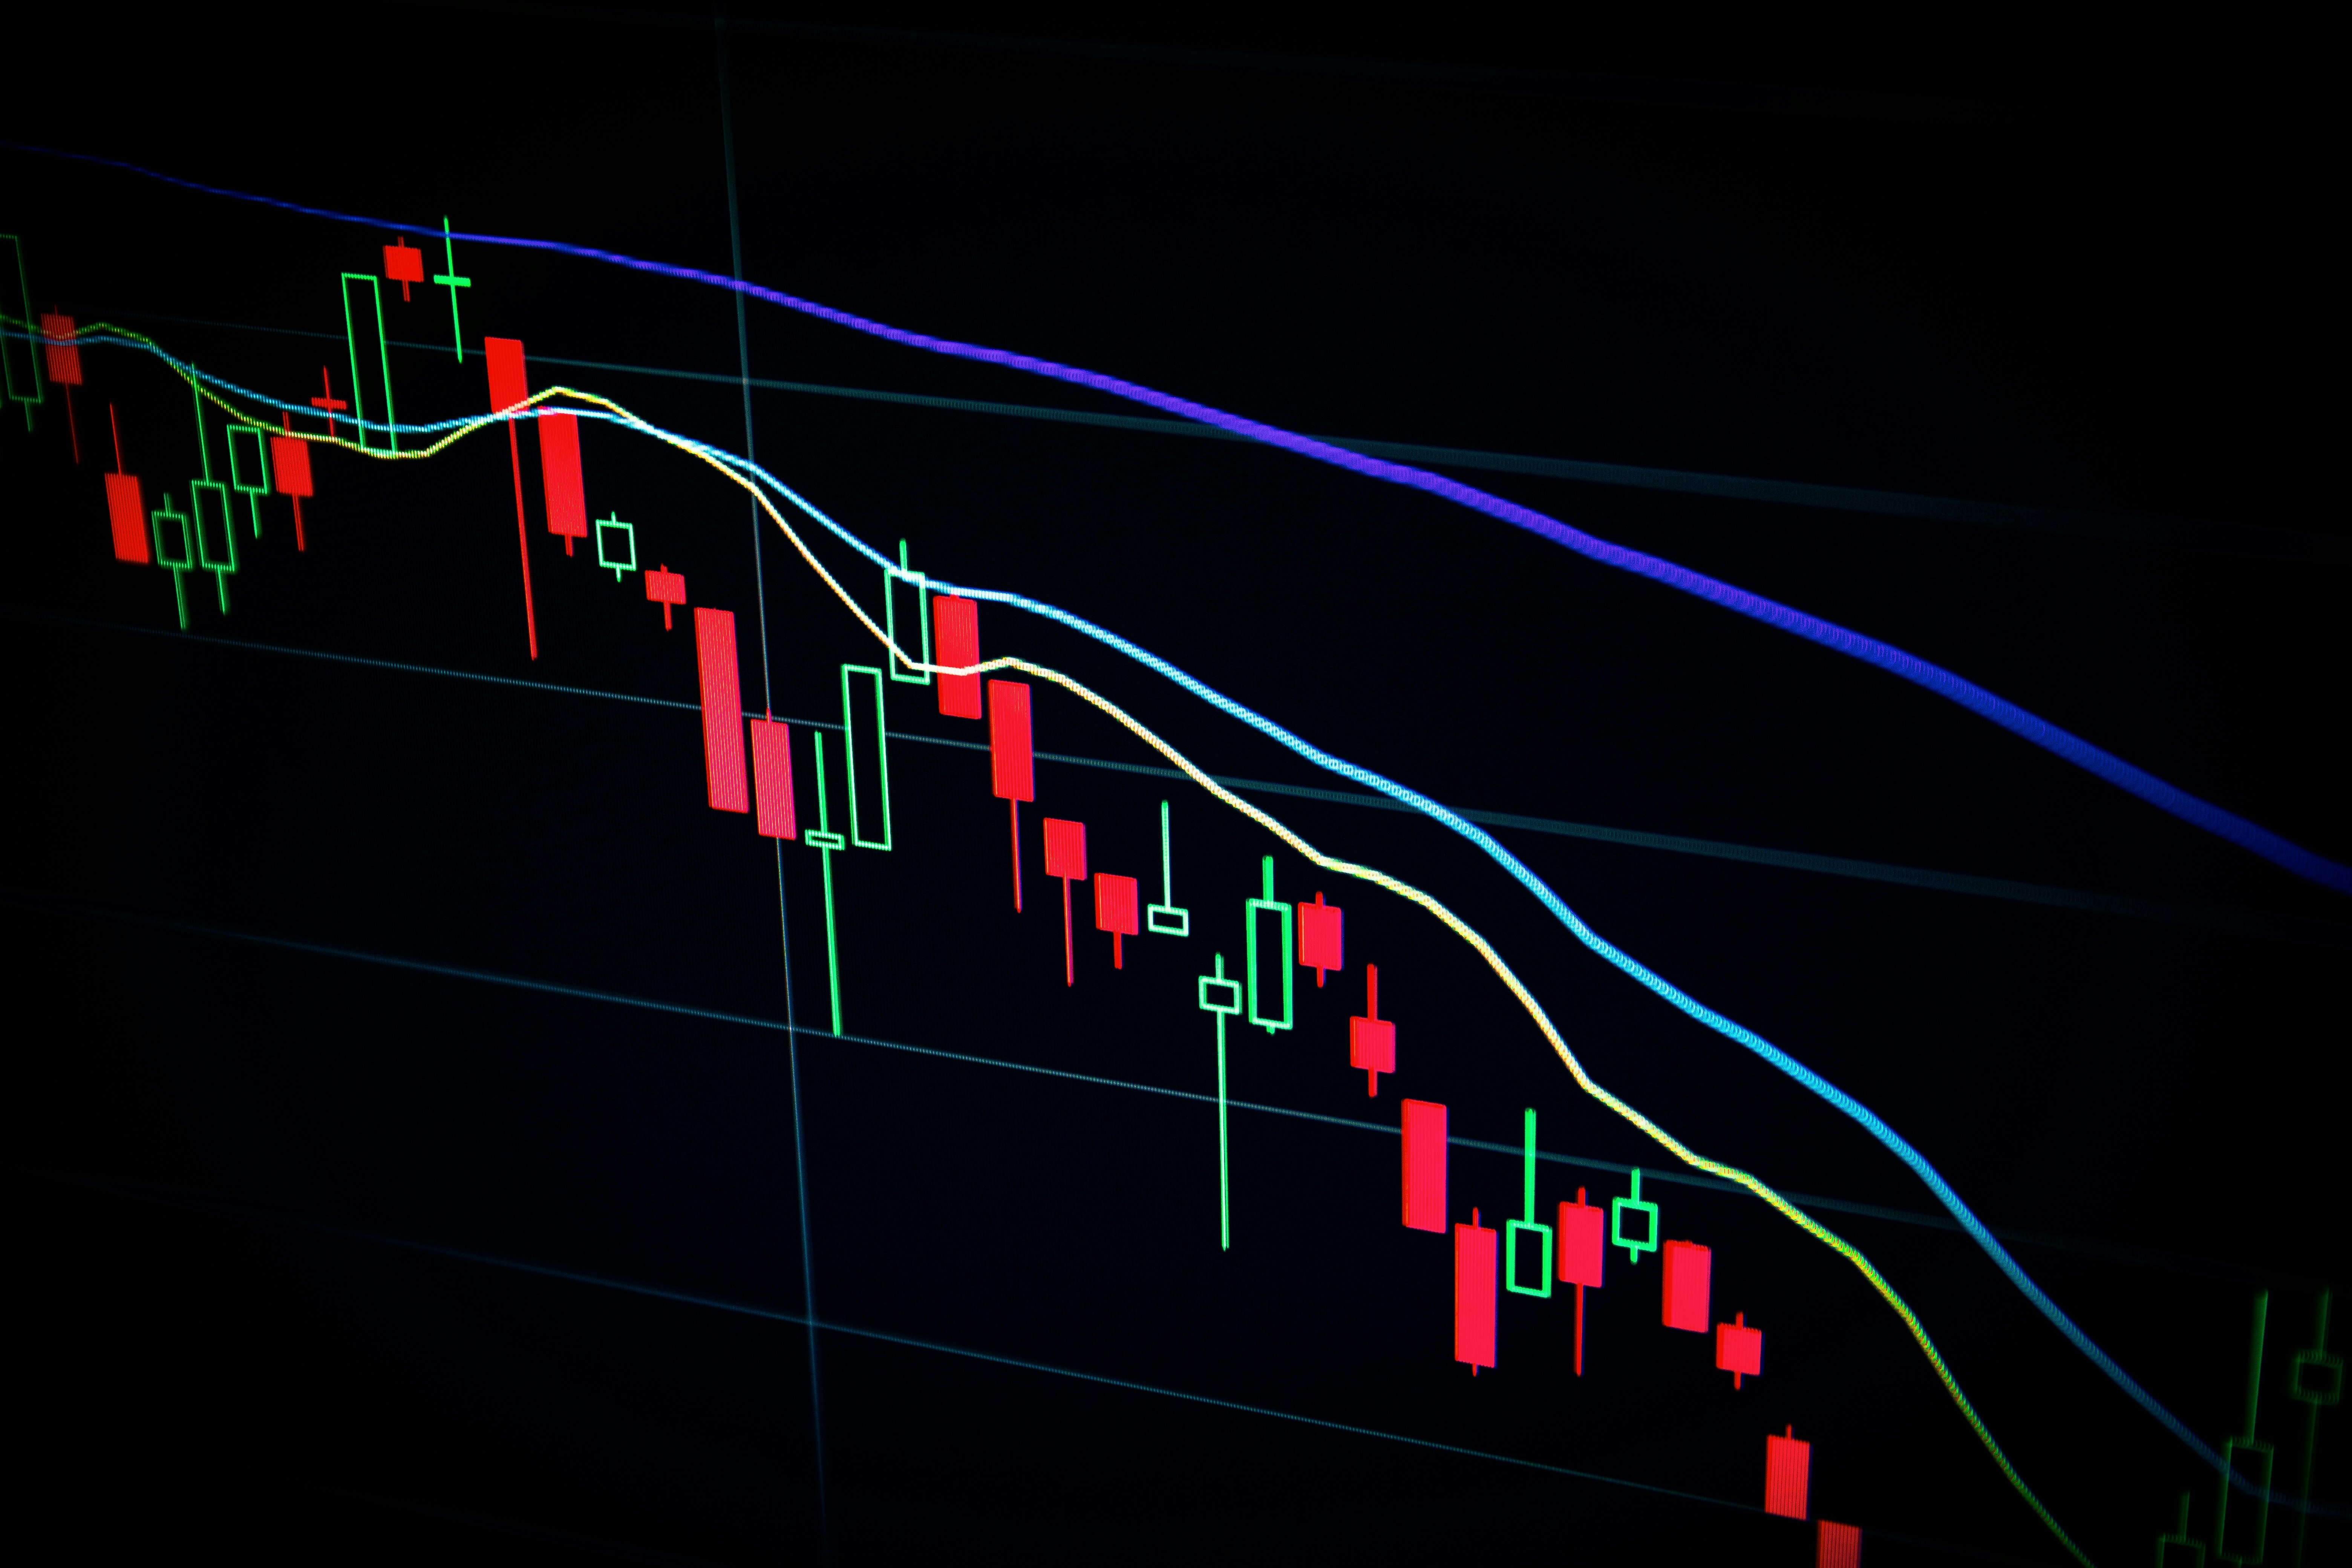
A downward trend is characterised by a series of progressively lower highs and lower lows on the price chart, indicating that selling pressure is dominating and prices are continuing to move lower over time.

A side trend, also known as a flat or ranging market, occurs when price highs and lows remain at roughly the same levels, indicating a lack of clear directional movement.

Trend lines help traders identify key turning points where price is more likely to move higher or lower. They act as visual guides for potential support and resistance areas within a trend.
Keep in mind that the more confirmations you see supporting an upward or downward direction, the stronger and more reliable that trend becomes. Well-established trends are generally more difficult to break than those that are only just beginning to form.