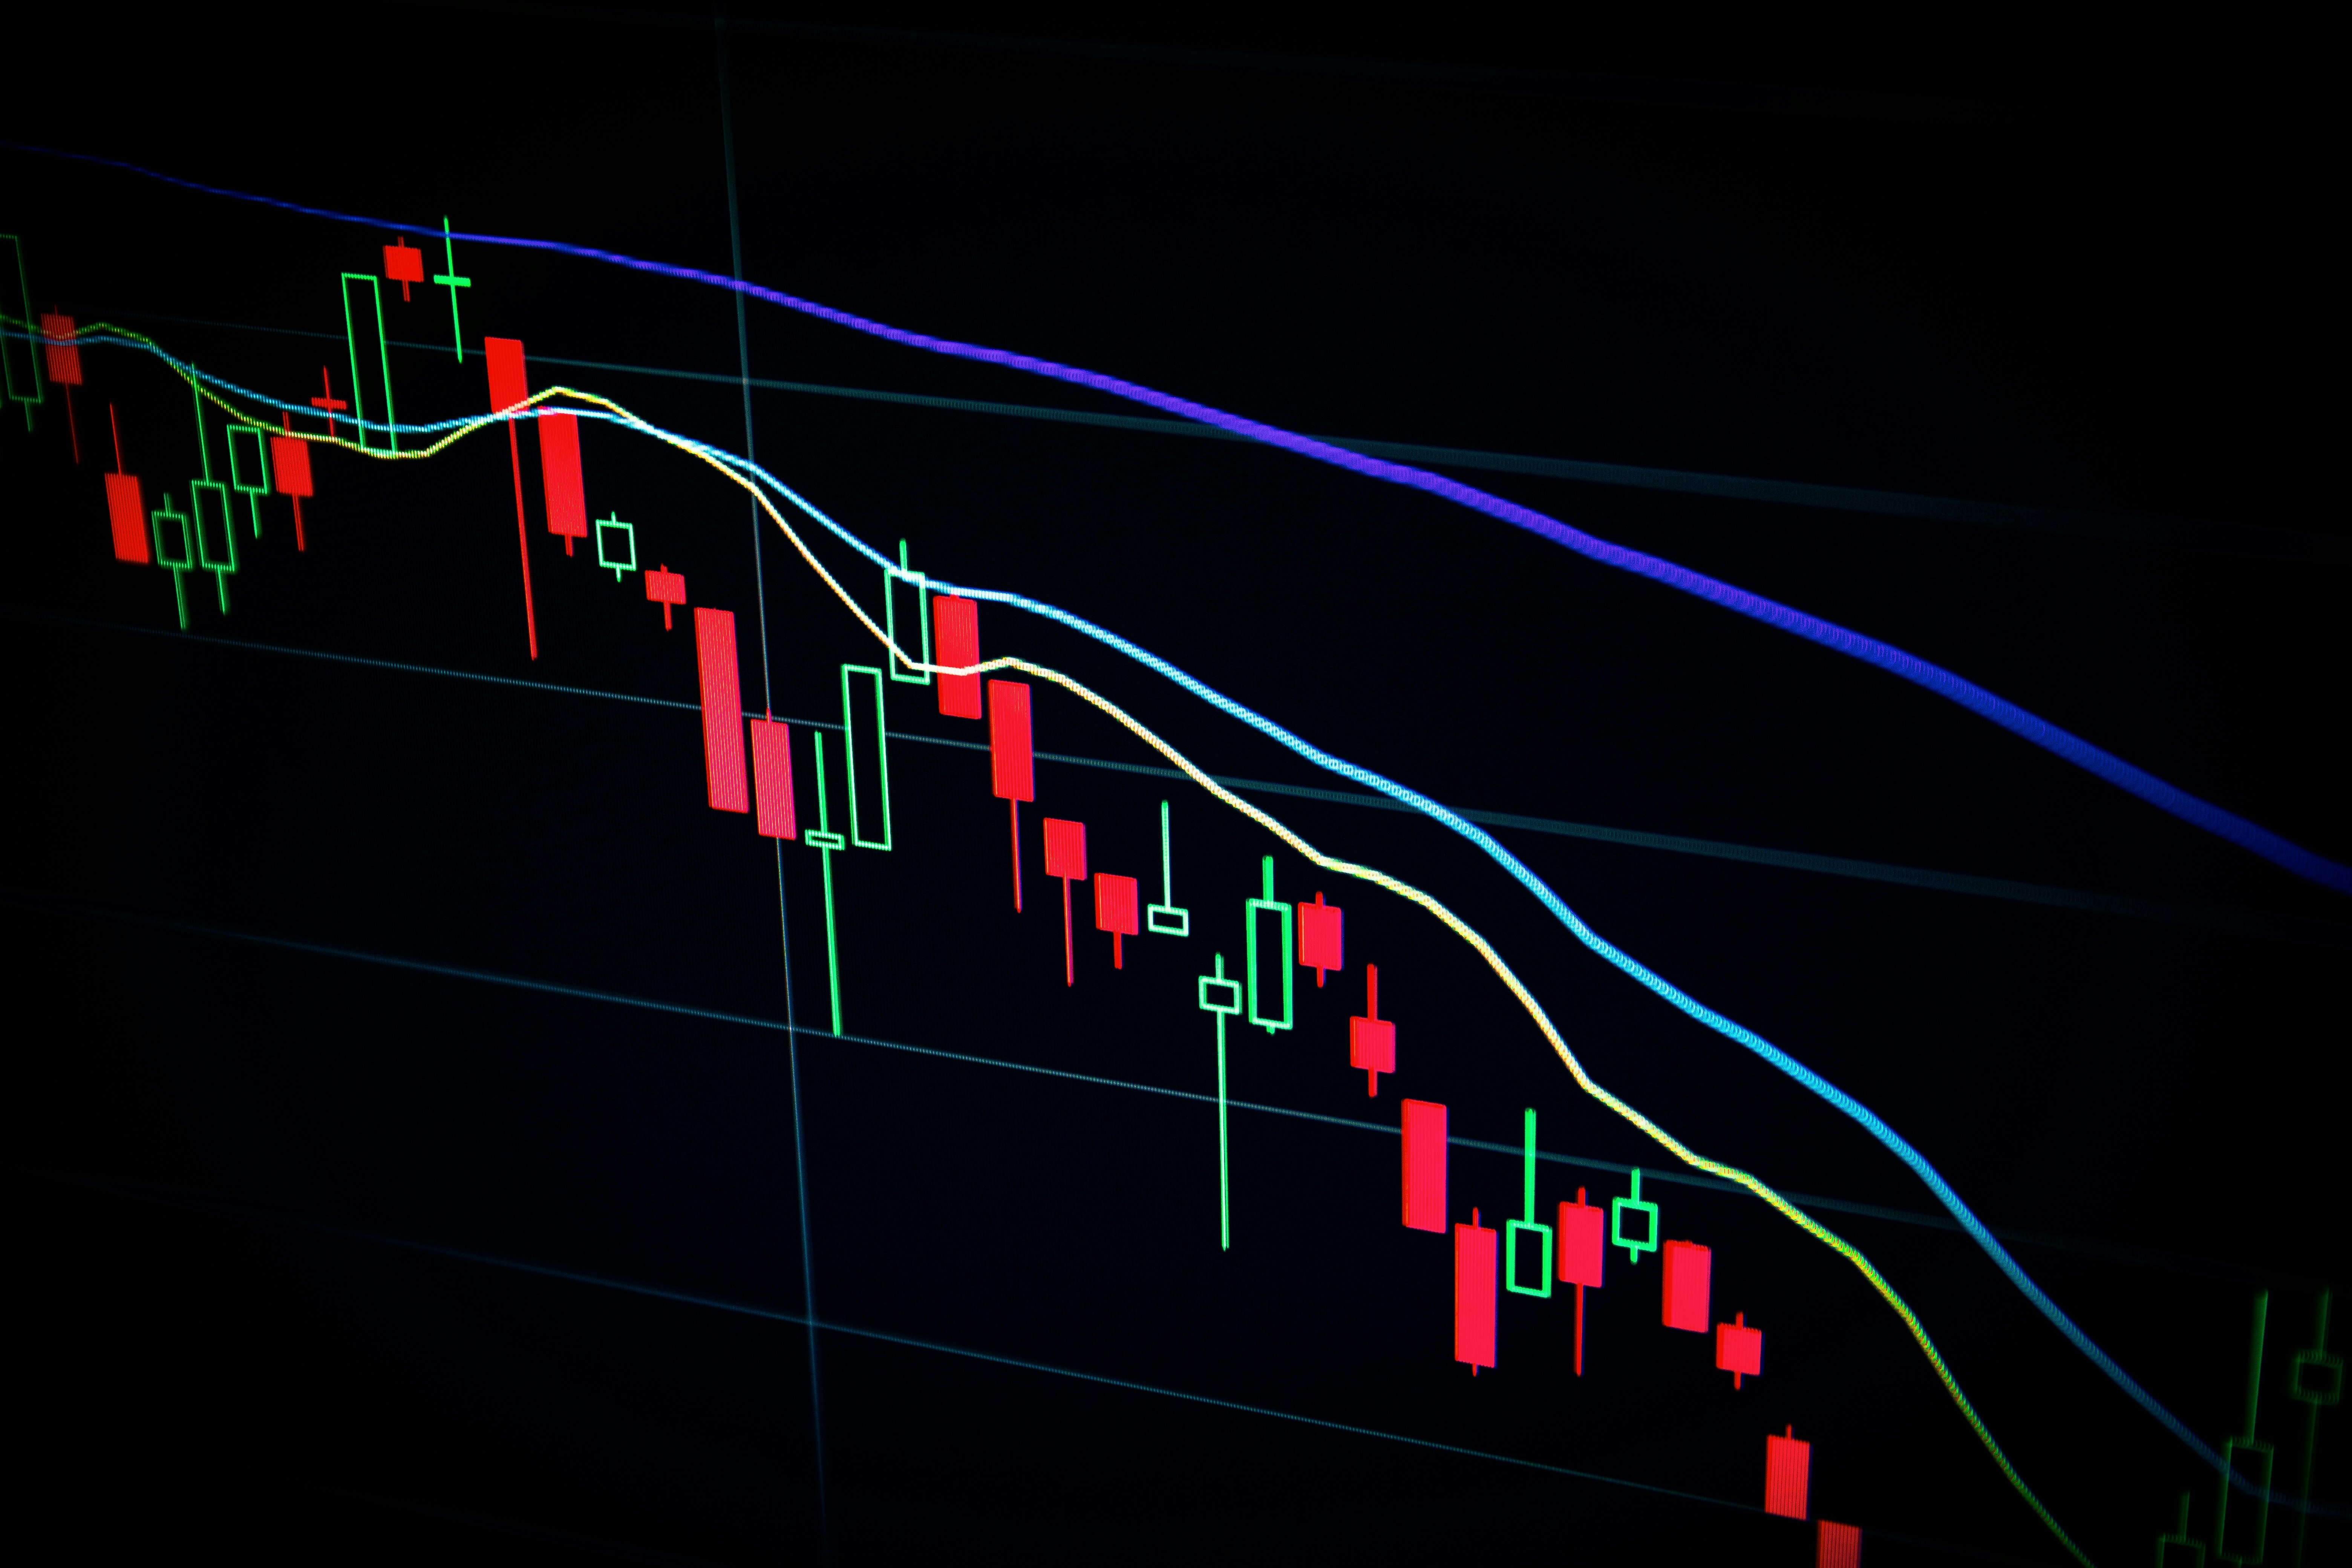
What is technical analysis? Traders use it to study price charts and understand how markets move. Instead of relying only on news, they focus on price behavior, patterns, and historical data to make decisions.
First, traders observe how price behaves over time. Then, they identify trends, reversals, and consolidation areas. As a result, they can build logical expectations about future movement.
In addition, charts simplify complex market data. They act as a visual language. Therefore, traders from different countries can recognize the same patterns and react in similar ways.
For deeper learning, check our support and resistance levels or read more on Investopedia.
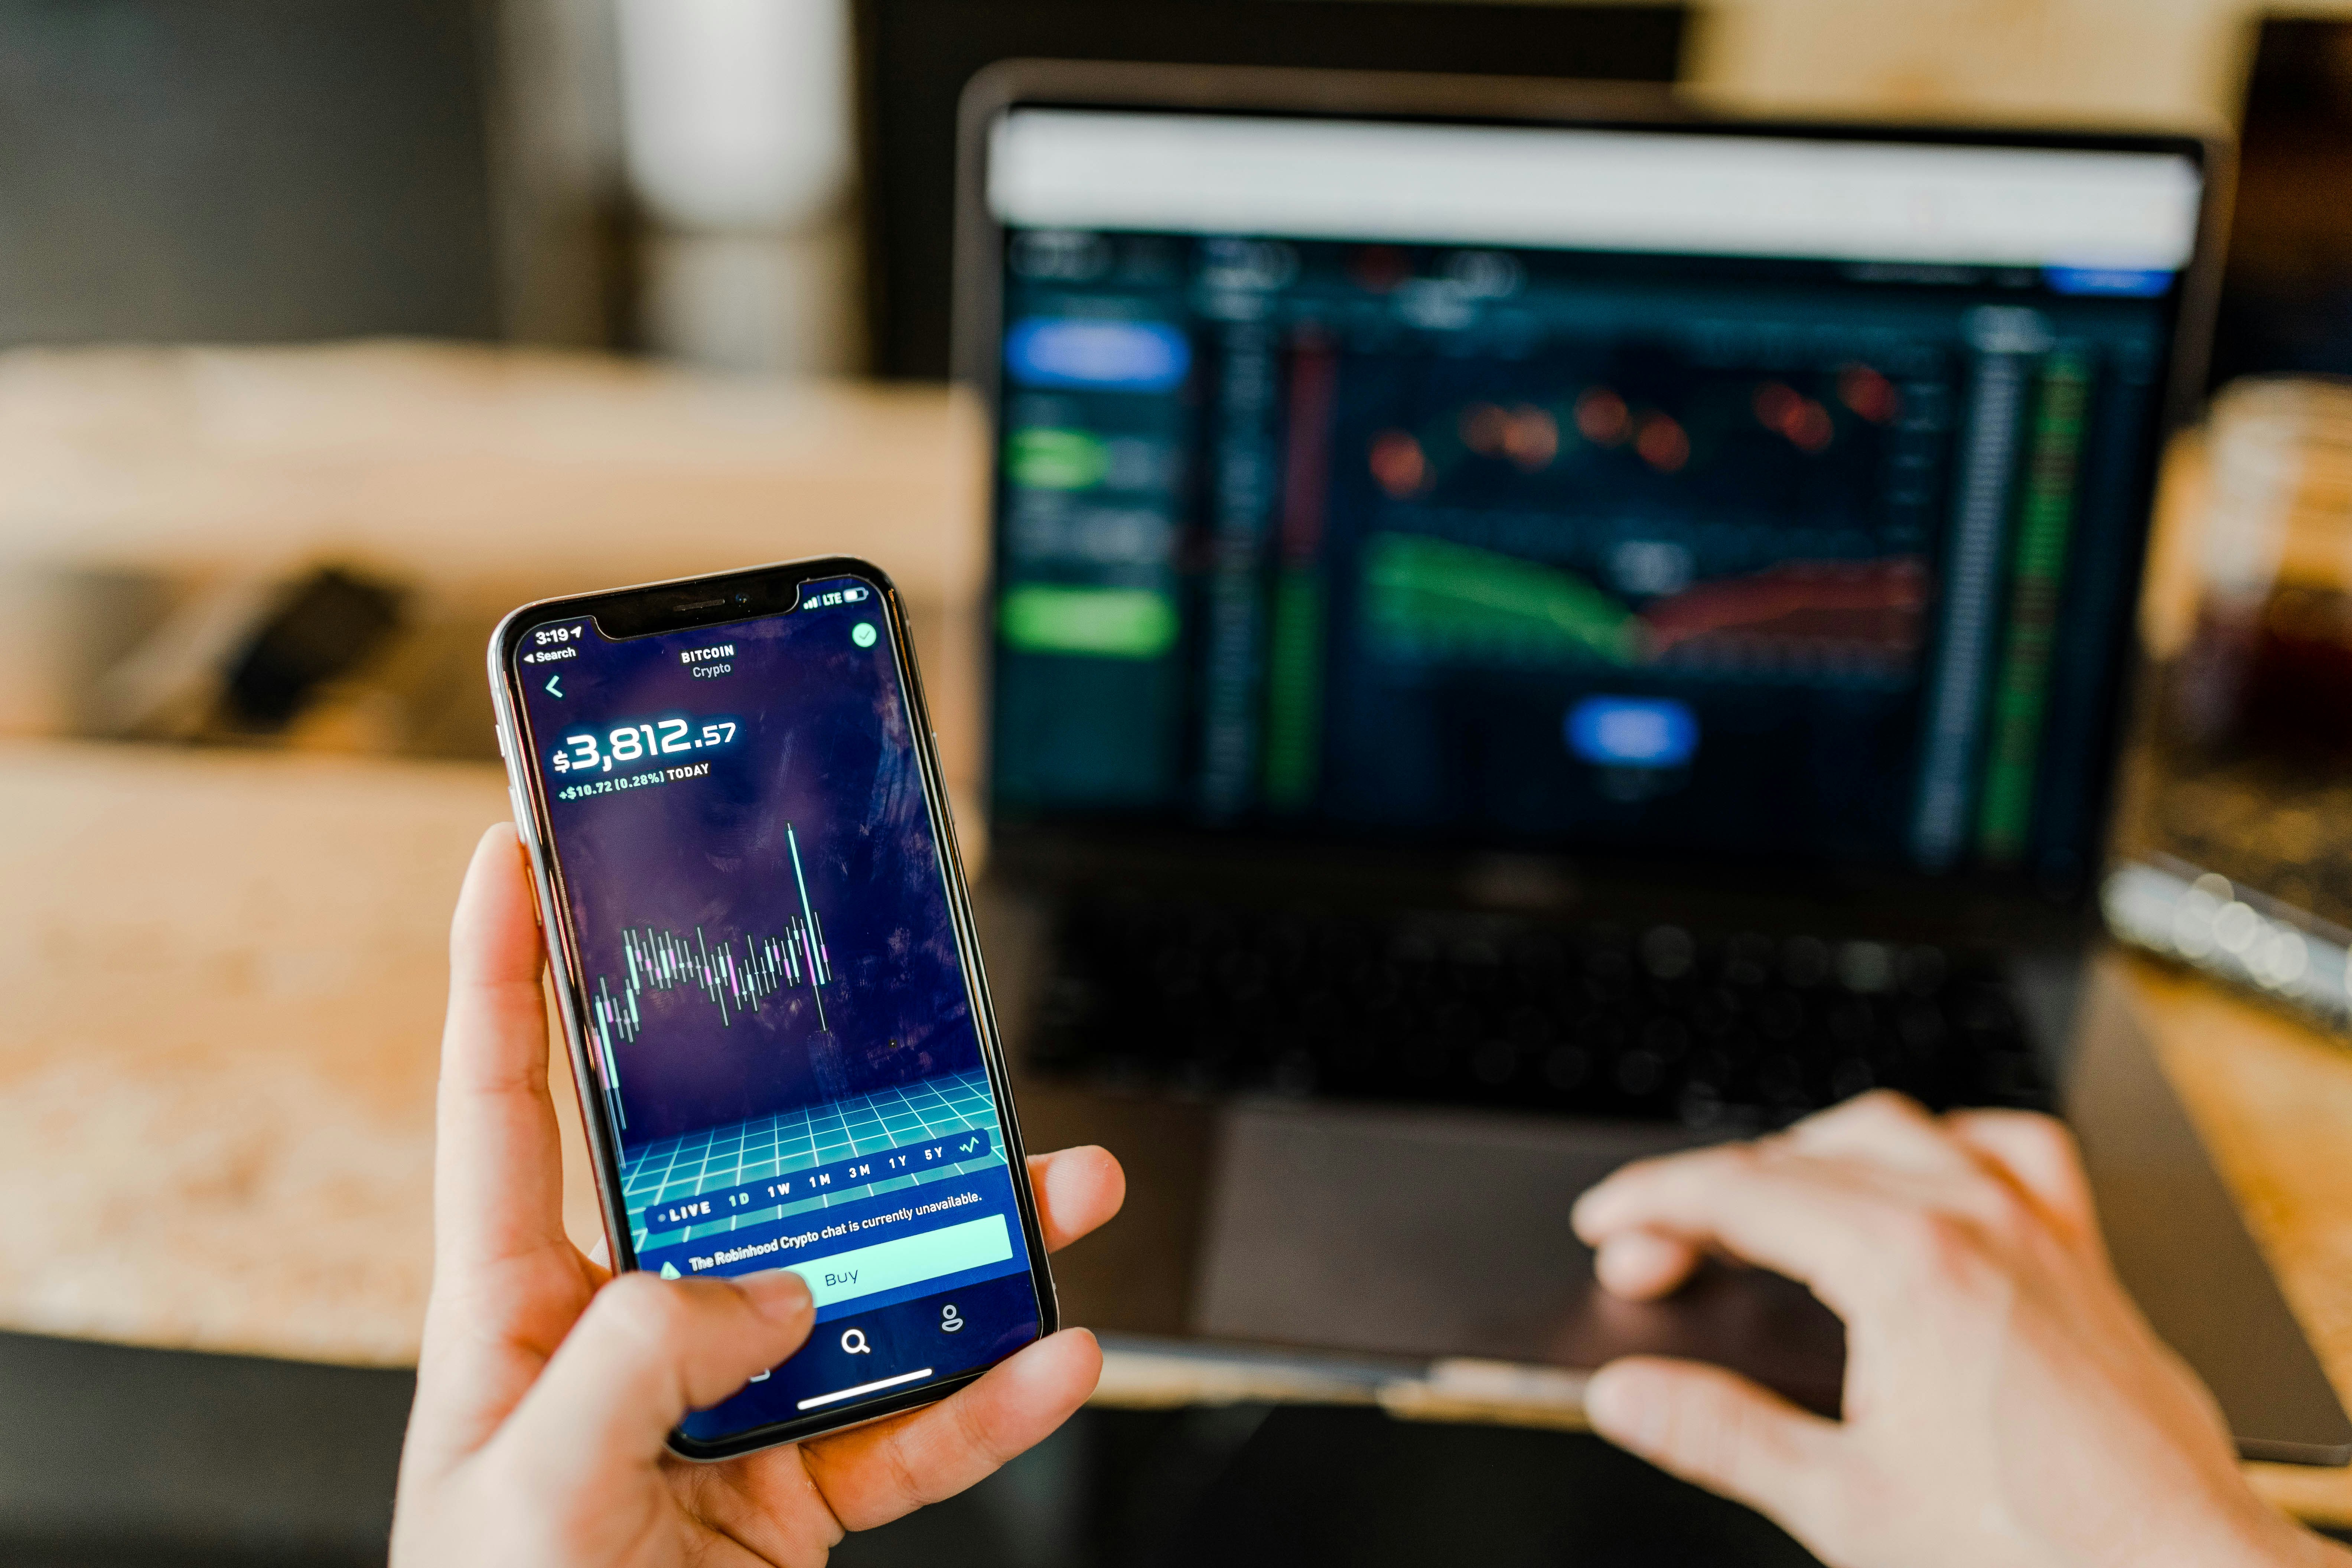
Technical indicators are tools traders use to analyze price behavior more clearly. They appear as lines, signals, or visual elements on the chart.
For example, some indicators show trend direction, while others highlight momentum. Because of this, traders can combine multiple tools to improve decision-making.
However, indicators should not be used alone. Instead, traders combine them with price action to get stronger confirmation.
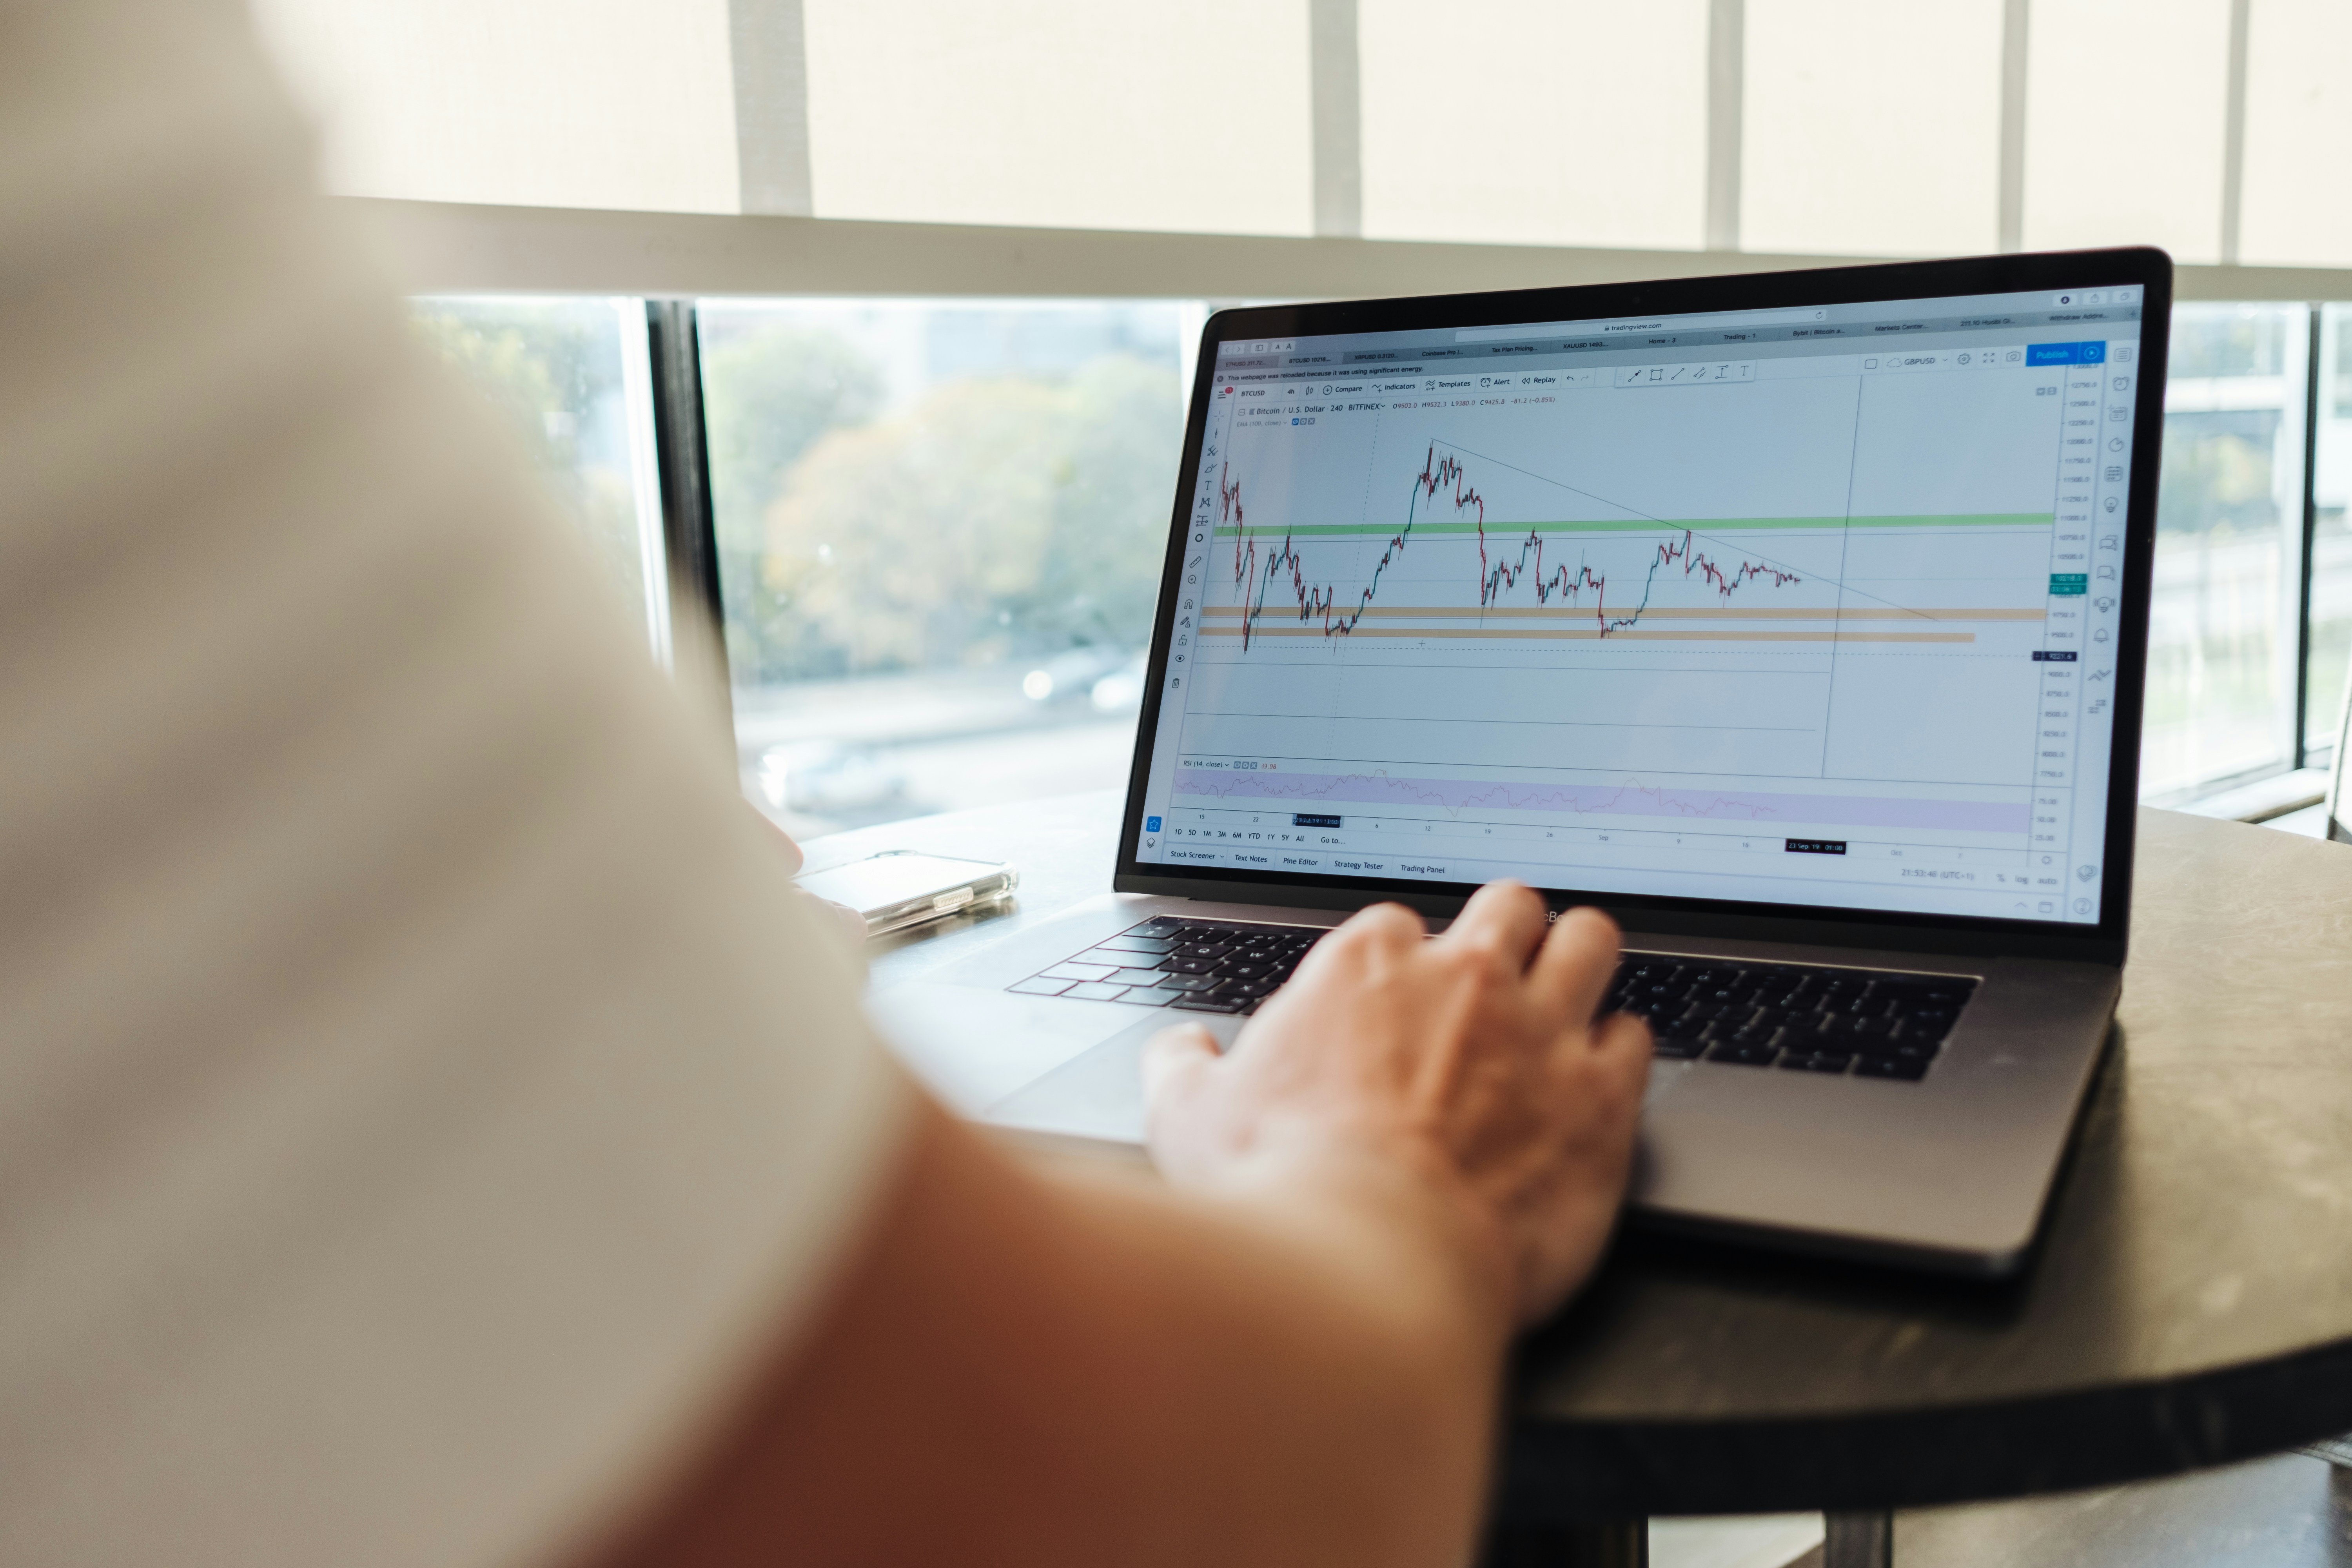
Indicators are often divided into trend tools and oscillators. Trend tools show direction, while oscillators highlight potential turning points.
For instance, oscillators measure momentum. Therefore, they can indicate whether a market is overbought or oversold.
As a result, traders often use oscillators to prepare for possible reversals rather than follow trends blindly.

Trend indicators help traders confirm market direction. They usually follow price rather than predict it.
Because they react after price moves, traders use them to validate trends instead of guessing reversals.
In most cases, combining trend indicators with other tools improves accuracy and reduces risk.
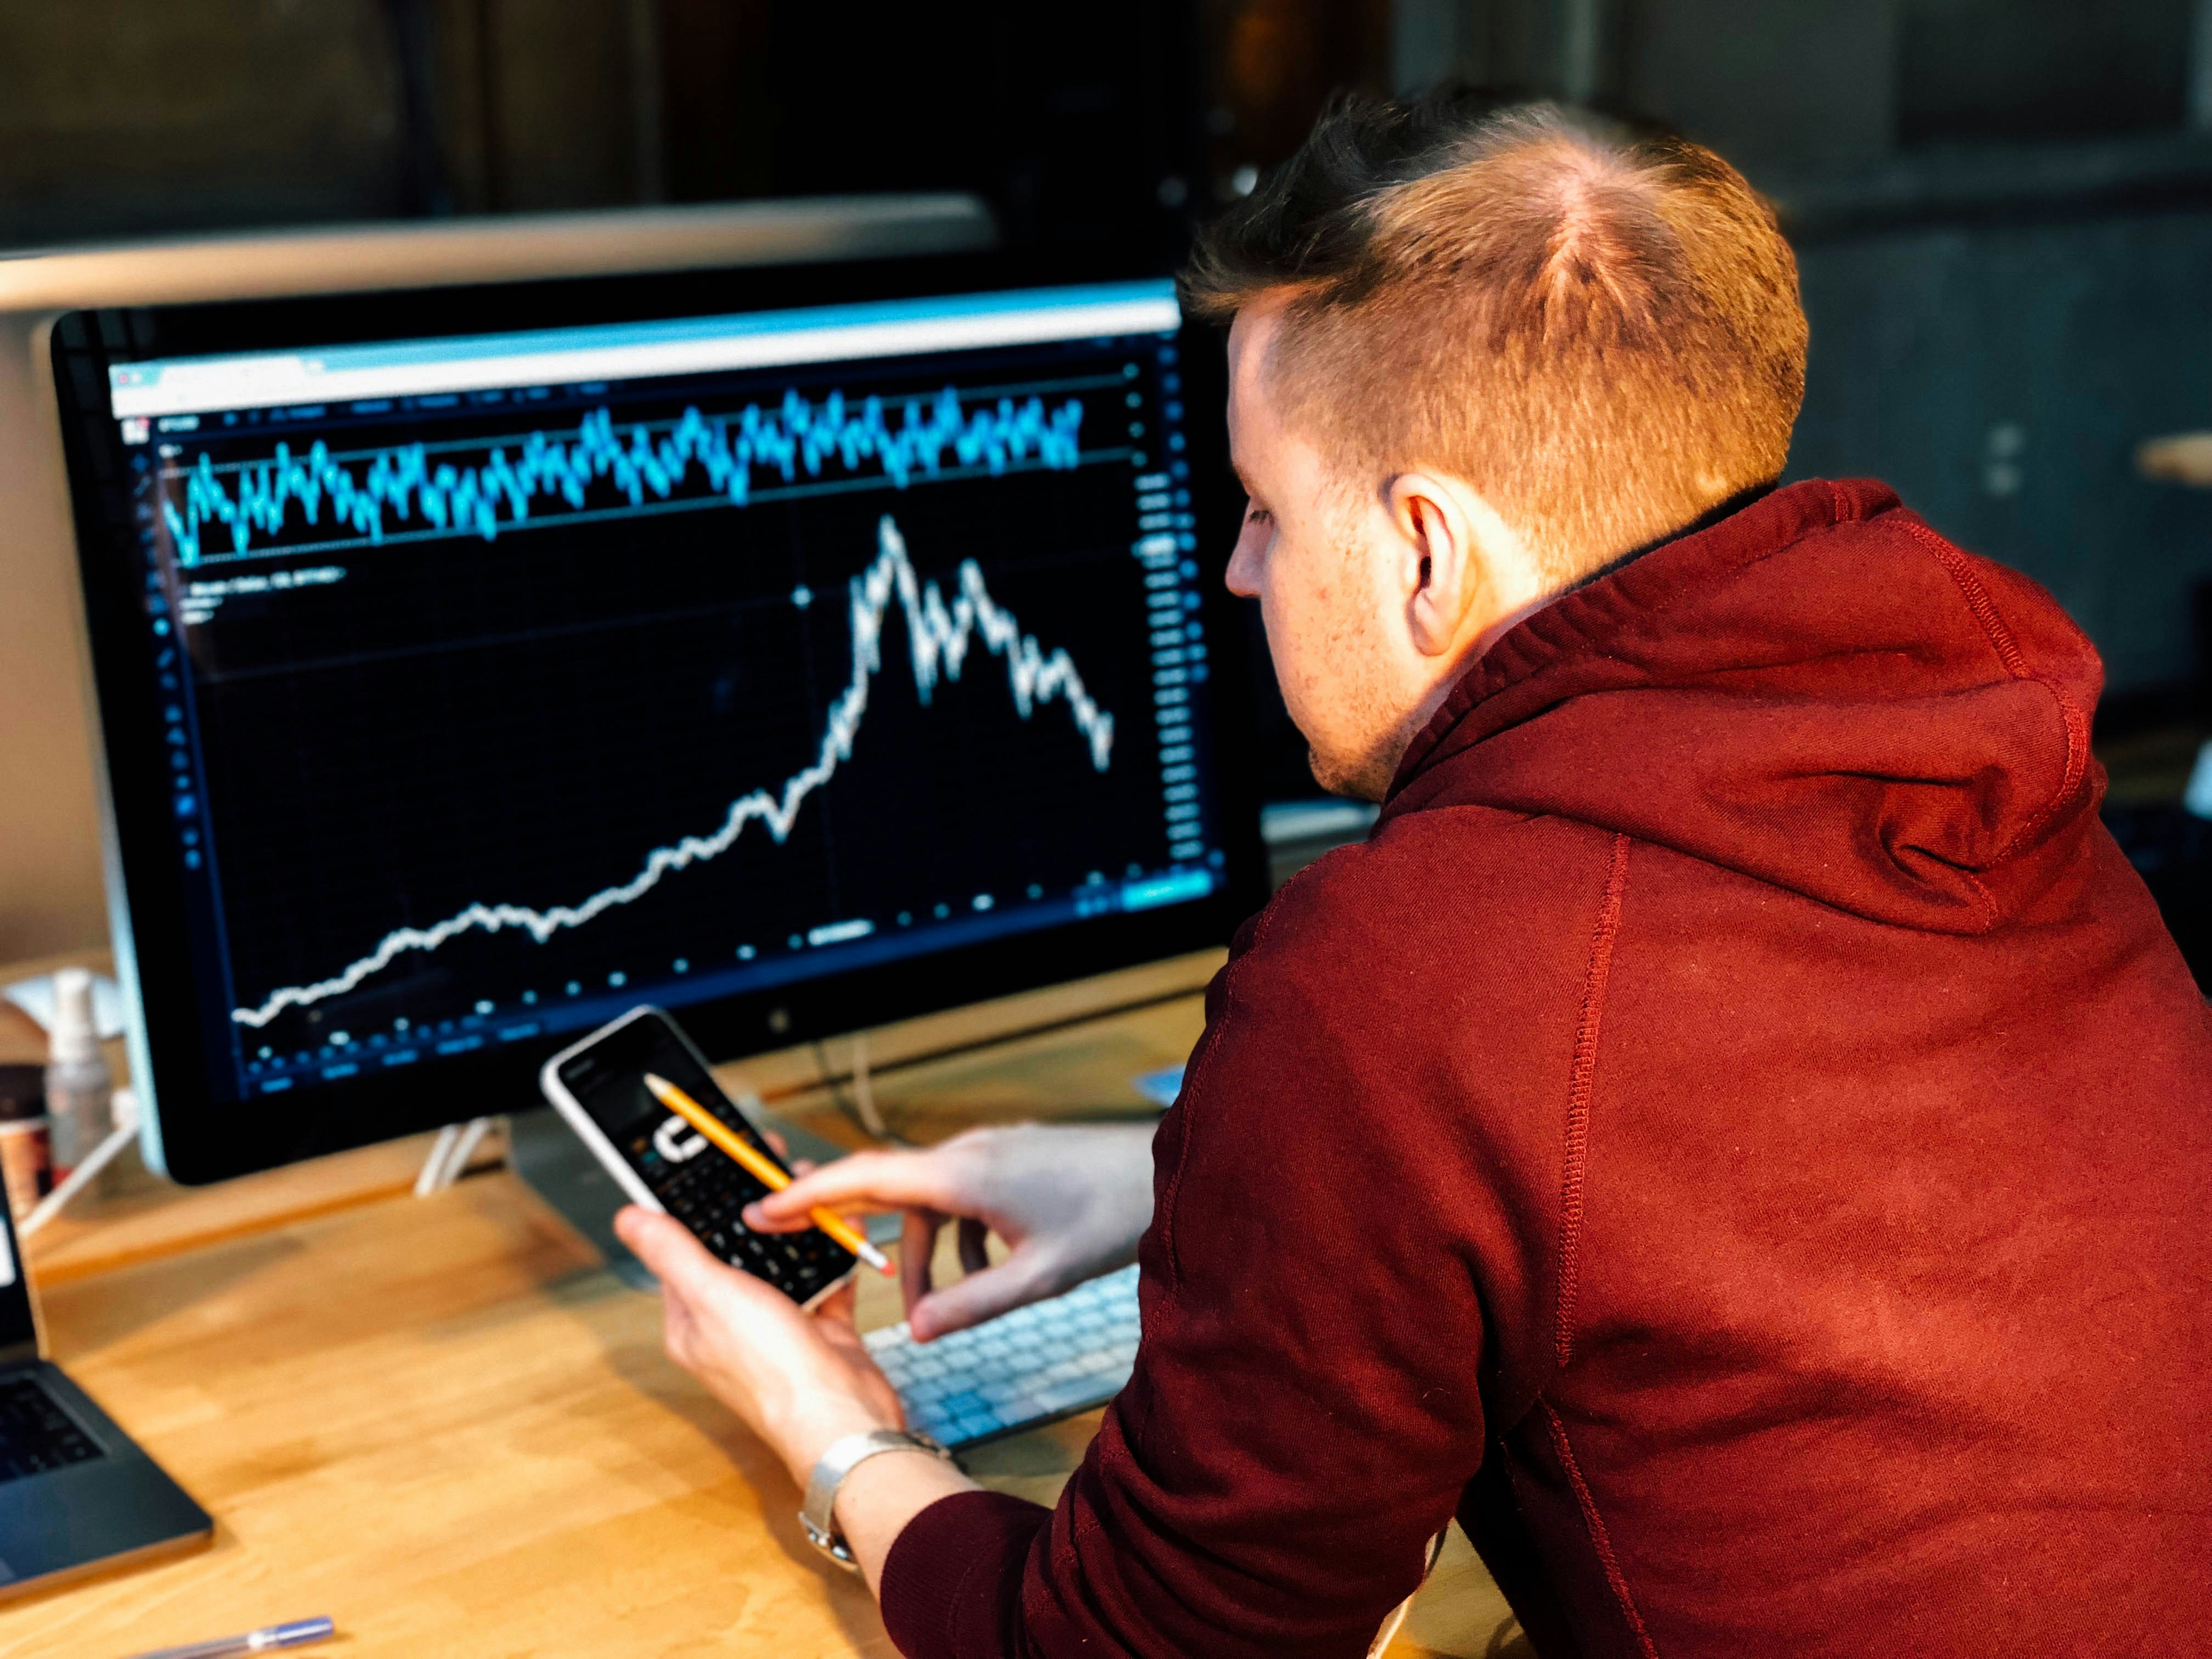
Oscillators focus on momentum and strength. They help traders understand whether a trend is strong or losing power.
For example, when momentum weakens, a reversal may happen soon. Therefore, traders watch oscillators closely near key levels.
Overall, chart analysis becomes more effective when traders combine patterns, indicators, and clear risk management.